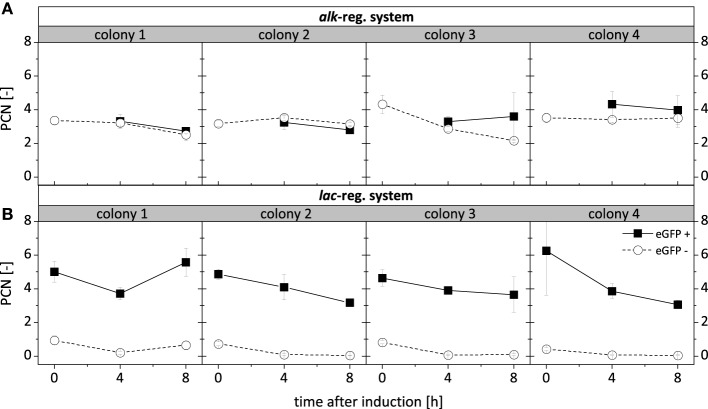
Figure 6.
Average PCN per cell after 0 h, 4 h and 8 h of induction of P. putida DOT-T1E recombinants. One thousand cells originating from the 8 respective cultures visualized in Figure 5 expressing the fusion construct styA-eGFP under control of the alk- (A) and the lac- (B) regulatory systems were sorted according to defined gates (Figure S9) for fluorescing (eGFP+) and non-fluorescing (eGFP−) cells. PCNs were determined in quadruplicates for each subpopulation and are presented as an average value with standard deviations.

