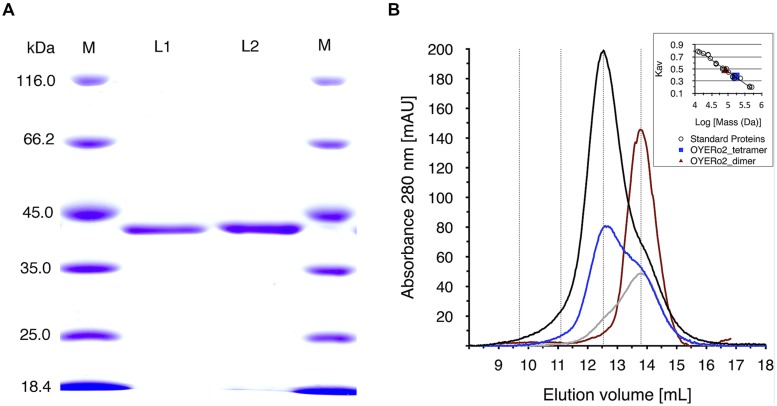
FIGURE 3.
(A) SDS-PAGE analysis of samples of OYERo2 and OYERo2a. Lane 1: marker proteins, lane 2: purified OYERo2, lane 3: purified OYERo2a, lane 4: marker proteins. (B) Analytical gel filtration of purified OYERo2 samples eluted from a Superdex 200 HR 10/30 column. Black line: 119 μM (high concentration), blue line: 59 μM (medium concentration), gray line: 30 μM (low concentration), red line: 30 μM enzyme in presence of 200 μM NADPH. The inset shows the calibration curve obtained from elution of standard proteins. Due to the calibration the following retention volumes are stressed by dotted lines: dimer: 13.8 mL, tetramer: 12.5 ml, octamer: 11.1 mL, hexadecamer: 9.7 mL. ND: no significant activity/conversion detected under steady-state conditions.

