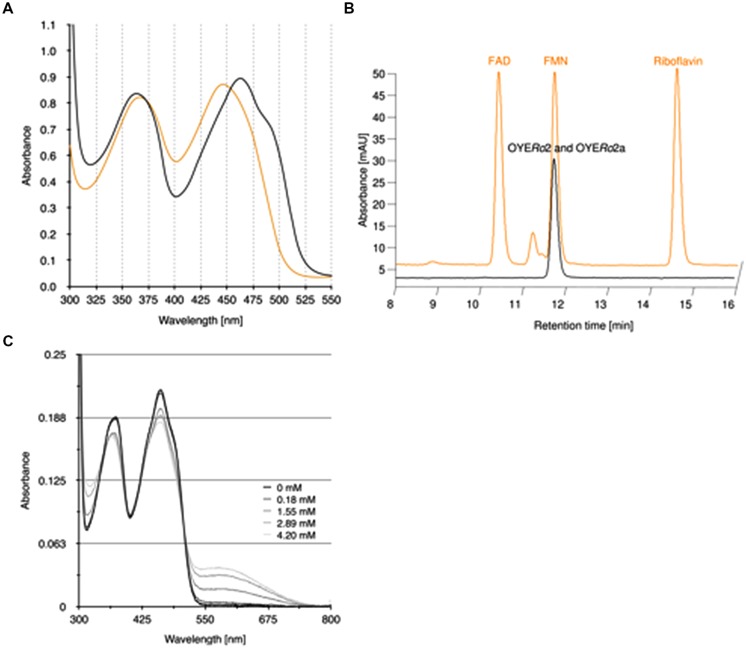
FIGURE 4.
Binding of flavin cofactor to OYERo2 and OYERo2a. (A) UV-VIS absorption spectra of 100 μM purified OYERo2 and of 100 μM purified OYERo2a (orange lines, overlapping) and a similar amount of free FMN (black line). (B) RP-HPLC on flavin samples extracted from purified OYERo2 and OYERo2a (black lines, overlapping) and on flavin standards FAD, FMN and riboflavin (orange line, with offset). (C) Spectral changes in OYERo2 upon titration with p-chlorophenol (0–4.2 mM) at 15°C. The enzyme concentration was 13.8 μM in 50 mM phosphate buffer (pH 7.1).

