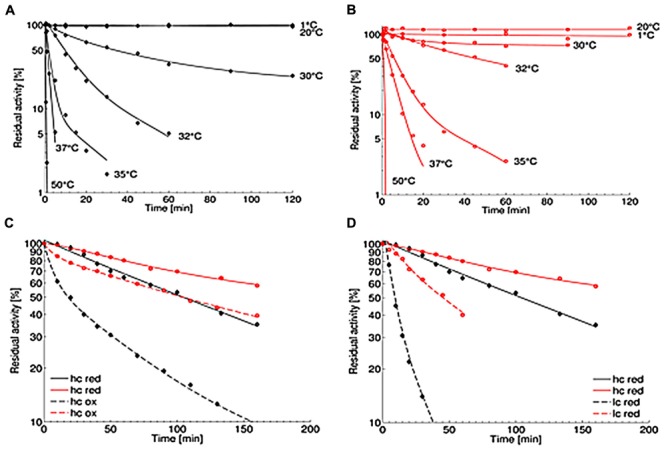
FIGURE 6.

Thermal stability of purified OYERo2 ( ) and OYERo2a (
 ). (A,B) Thermal stability was measured applying the standard assay. Protein was incubated in 50 mM phosphate buffer (pH 7.1) at various temperatures (1–50°C) and added to the assay in a final concentration of 30 nM. (C) Inactivation at 32°C with constant high protein concentrations of 7 μM (hc) and varying NADPH concentrations: 1 mM (red; continuous lines) and 0 mM (ox; dashed lines). (D) Inactivation at 32°C with various protein concentrations under reducing conditions: 7 μM protein and 1 mM NADPH (hc; continuous lines) and 30 nM protein and 0.14 mM NADPH (lc, dashed lines).
