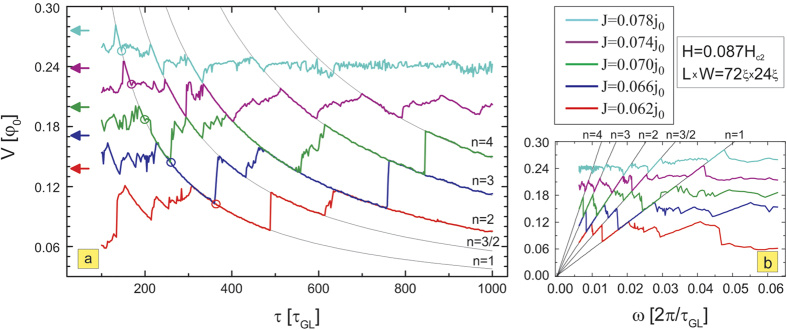
Figure 2. Voltage resonances.

(a) Voltage is plotted versus the period τ of the oscillating pinning landscape shown in Fig. 1, for a given sample size and magnetic field, and for five different values of the applied current. Arrows indicate the voltage in absence of pinning for the corresponding current, while dots indicate the transition between two dynamic regimes: vortex tapping at low τ and vortex pinning at high τ. The black lines highlight the resonances where  as further shown in (b) where voltage is plotted against pinning frequency ω = 2π/τ, and clearly shows a linear dependence when resonance conditions are met.
