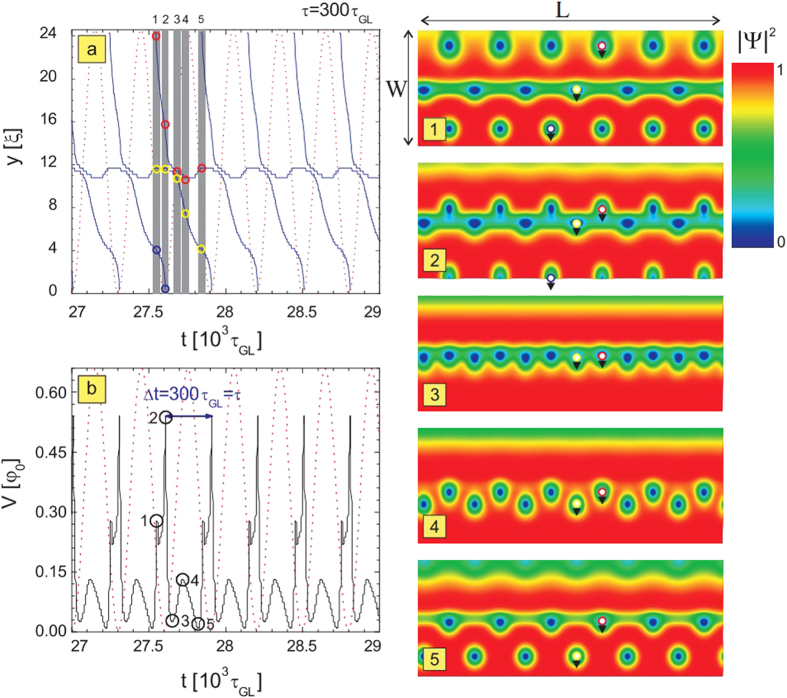
Figure 3. Vortex trajectory and temporal voltage response at the first resonance.
The location of the vortex core traveling across the sample as a function of time (a), and the corresponding change in the voltage (b), for one example of the system at the first resonance (in particular, for J = 0.066j0 and  , see Fig. 2). Dotted lines show the profile of the time-dependent pinning potential, where minima of the dotted lines represent the ON state of the pinning, and the maxima represent the OFF state. Points 1–5 denote one cycle of the vortex dynamics, marking the instances when the new vortex row enters (cycle begins) (1), some of the the previously existing vortices exit (2), the vortex row is trapped in the depletion region (3), the remaining preexisting vortices are depinned from the depletion region (4), and the remaining previously existing vortices exit the sample (5). Corresponding snapshots of the Cooper-pair density for states 1–5 are given in the right panel, showing rows containing six vortices in parallel and simultaneous motion. The resulting periodicity of the voltage during vortex motion exactly matches the period of the pinning, and entering/exiting vortices provide a flux change of exactly one flux-quantum per vortex row during that period.

