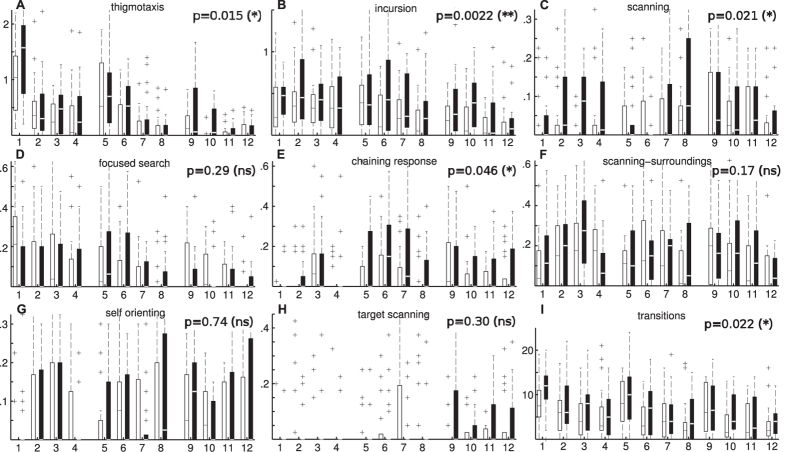
Figure 5.
(A–H) Average segment lengths for each strategy adopted by stress (black) and control group (white) of animals for a set of 12 trials divided in 3 sessions (days). Plots show the average length in meters that animals spent in one strategy during each trial. Bars represent the first and third quartiles of the data; line shows the median and crosses the outliers. Whiskers (when shown) indicate minimum and maximum values. A Friedman test was used to compare both groups of animals over the complete set of trials; p-values are shown on the top right (see Methods for a discussion of the Friedman test and p-values). The results show that, as expected, stressed animals display longer average paths much more often but the increase is non-uniform among the different strategies. According to the plots there is a clear difference in the path lengths for the thigmotaxis, incursion, and scanning strategies, all of which are characterised by low chance of finding the platform. For the scanning-surroundings, self-orienting, and target scanning strategies, all which are associated with an increased chance of finding the platform, no statistically significant differences were found. Chaining response shows a slight difference in favour of the stress group; focused-search shows no significant differences. These results may explain why stressed animals sweep longer paths but on average they don’t find the platform faster that non-stressed animals (Fig. 1). (I) Number of transitions between strategies for both groups showing that stressed animals change their behaviour more often within single trials.

