. 2015 Aug 19;4:e07597. doi: 10.7554/eLife.07597

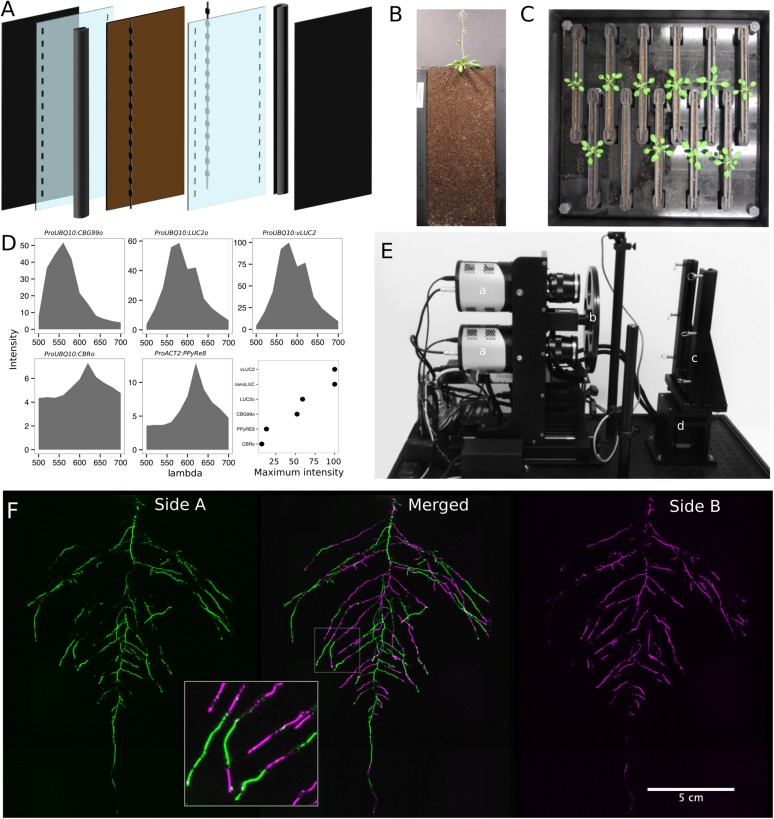
Figure 1. GLO-Roots growth and imaging system.

(A) 3D representation of the different physical components of the rhizotron: plastic covers, polycarbonate sheets, spacers, and rubber U-channels. Blueprints are provided in Supplementary file 1. In brown, soil layer. (B) A 35-day-old plant in rhizotron with black covers removed. (C) Top view of holding box with eleven rhizotrons. (D) In vivo emission spectra of different luciferases used in this study. Transgenic homozygous lines expressing the indicated transgenes were grown on agar media for 8 days. Luciferin (300 μM) was sprayed on the seedlings and plates were kept in the dark and then imaged for 2 s at wavelengths ranging from 500 to 700 nm. Five intensity values were taken from different parts of the roots of different seedlings and averaged. Relative maximum intensity values are indicated in the lower right graph. (E) GLO1 (Growth and Luminescence Observatory 1)-imaging system. The system is composed of two back illuminated CCD cameras (a) cooled down to −55°C. A filter wheel (b) allows for spectral separation of the different luciferases. On the right, a rhizotron holder (c) is used to position the rhizotrons in front of the cameras. A stepper motor (d) rotates the rhizotron 180° to image both sides. (F) A 21 DAS plant expressing ProUBQ10:LUC2o was imaged on each of two sides of the rhizotron; luminescence signal is colorized in green or magenta to indicate side. In the middle of the panel, a combined image of the two sides is shown. The inset shows a magnified part of the root system.

DOI: http://dx.doi.org/10.7554/eLife.07597.004

Figure 1—source data 1. Two way ANOVA p-values comparing plants grown in MS media vs plants grown in soil (pots or rhizotrons) and plants collected at day or night.
We used p-value < 0.00065 threshold based on Bonferroni adjustment for multiple testing.
elife07597s001.xlsx (25.8KB, xlsx)
DOI: 10.7554/eLife.07597.005
Figure 1—source data 2. Luminescence intensity values of the different luciferase isoforms across the emission spectrum.
elife07597s002.csv (11.6KB, csv)
DOI: 10.7554/eLife.07597.006
Figure 1—source data 3. Gene expression values used to construct the PCA of root samples.
Shoot fresh weight (FW), shoot area, lateral root number and primary root length of plants grown in different containers and media.
elife07597s003.xls (64.5KB, xls)
DOI: 10.7554/eLife.07597.007
Figure 1—source data 4. Gene expression values used to construct the PCA of shoot samples.
elife07597s004.csv (19.7KB, csv)
DOI: 10.7554/eLife.07597.008
Figure 1—source data 5. Shoot Fresh Weight (FW) and primary root length of plants grown with or without luciferin.
elife07597s005.csv (595B, csv)
DOI: 10.7554/eLife.07597.009
Figure 1—source data 6. Ground truth and GLO-RIA measured values of directionality, depth and width use for validation.
elife07597s006.xls (12.6MB, xls)
DOI: 10.7554/eLife.07597.060

Figure 1.

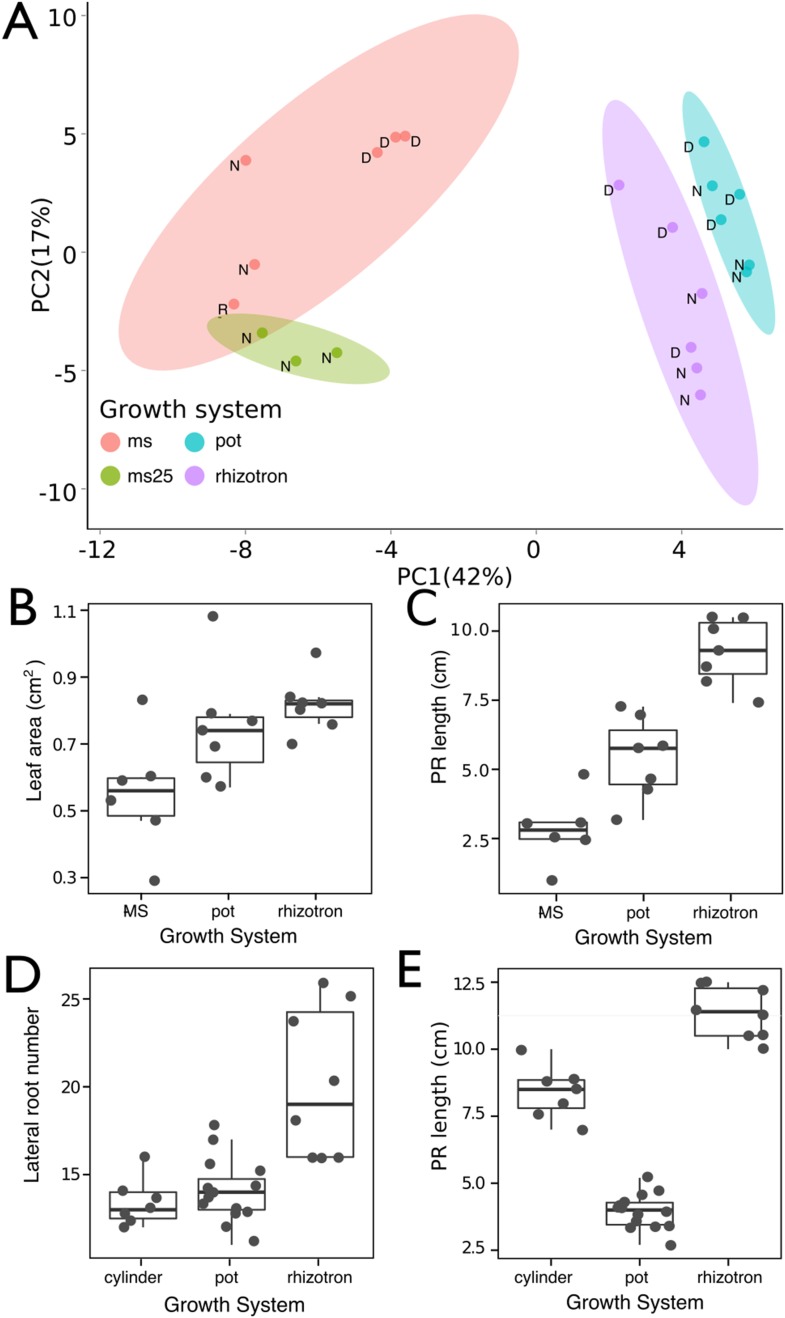
Figure 1—figure supplement 1. Effect of different growth systems on gene expression and growth.

Figure 1—figure supplement 1.

(A) Principal components analysis (PCA) score plot of a set of 76 genes analyzed by qPCR from root samples of plants grown in MS plates, pots, and rhizotrons. After 15 DAS, three plants were collected at the end of the day [D] and three were collected at the end of the night [N]. (ms = plant grown in full ms and 1% sucrose, ms25 = plants grown in 25% of full ms). (B) Leaf area and (C) primary root length of plants of the same age (15 DAS) as the ones used for the qPCR experiment (n = 6–7). (D) Lateral root number and (E) primary root length of 18 DAS plants grown in 30-cm tall cylinders, pots, and rhizotrons, all with a volume of 100 cm3 (n = 6–12 plants). Analysis of Variance (ANOVA) analysis with p < 0.01 was used to test significant differences between the different parameters.
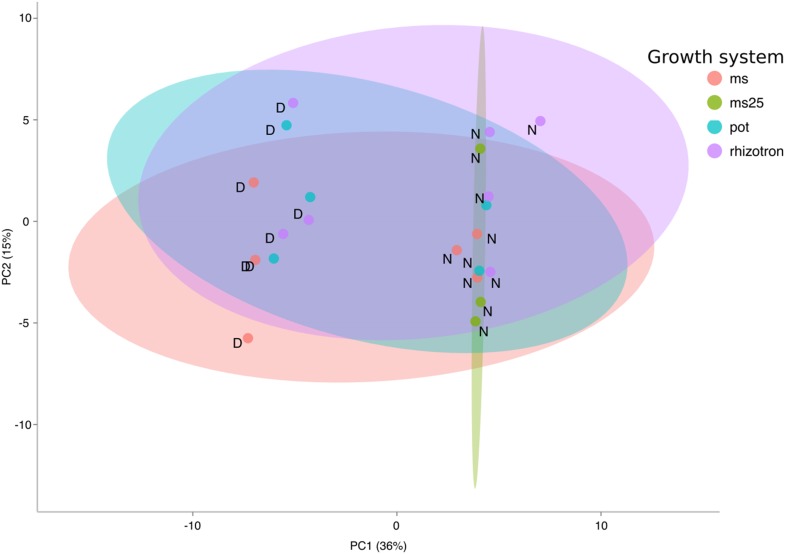
Figure 1—figure supplement 2. PCA plot of shoots of the same samples analyzed in Figure 1.

Figure 1—figure supplement 2.

See Figure 1 for more details regarding experimental conditions used.
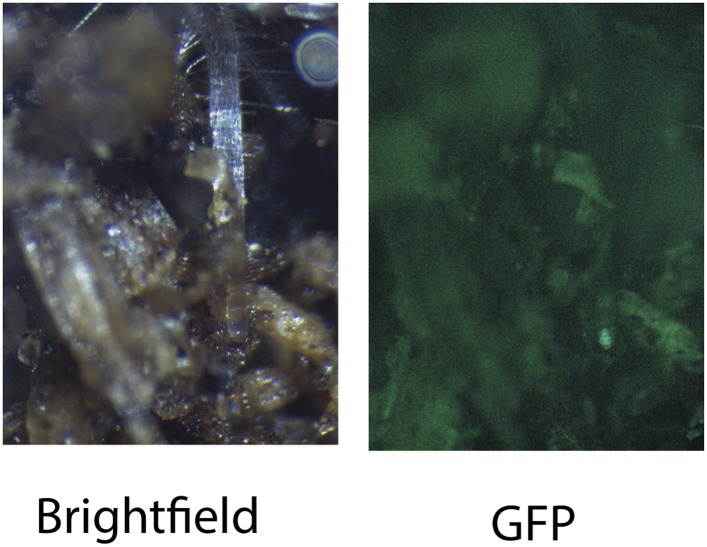
Figure 1—figure supplement 3. Image of an Arabidopsis root in soil imaged with white light (brightfield) or epifluorescence.

Figure 1—figure supplement 3.

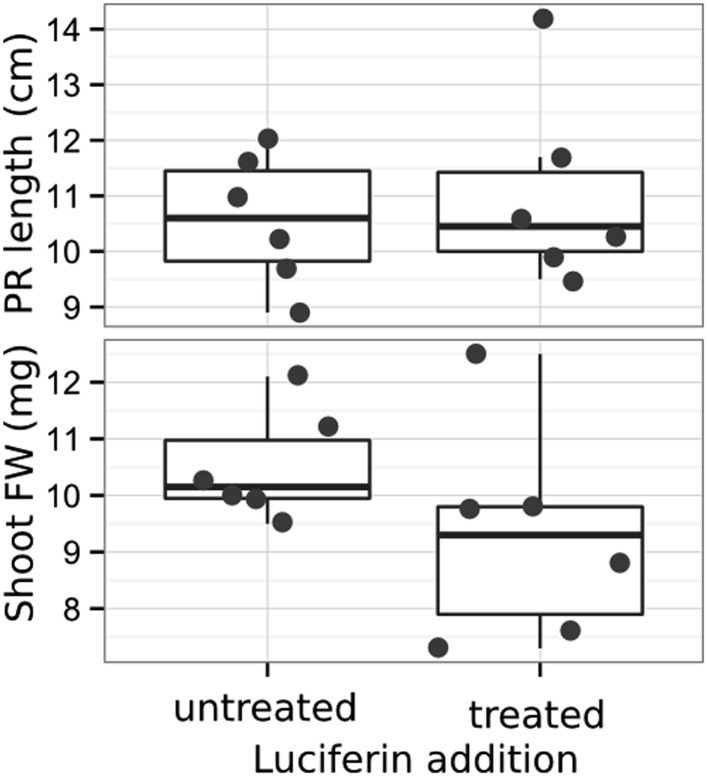
Figure 1—figure supplement 4. Effect of luciferin addition on primary root length and shoot size of 14 DAS seedlings that were either continuously exposed to 300 μM luciferin from 9 DAS after sowing or not (n = 6-7 plants).

Figure 1—figure supplement 4.

T-test showed no significant differences between treatments at threshold of p < 0.01.
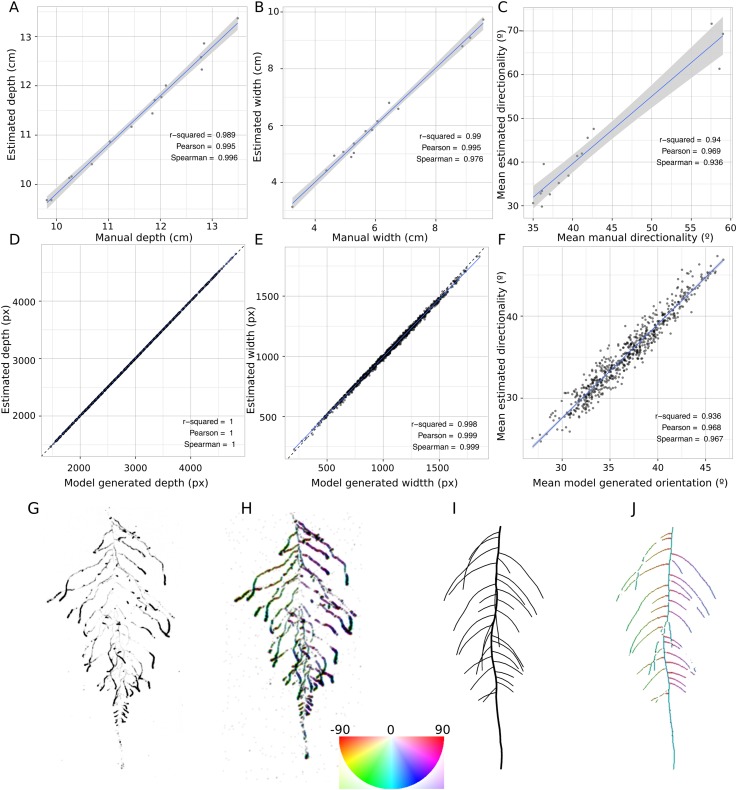
Figure 1—figure supplement 5. GLO-RIA ground truth comparison.

Figure 1—figure supplement 5.

Tests of GLO-RIA were performed using two approaches. We first manually quantified root system depth (A) width (B) and average lateral root angle (C) in a set of 15 root systems corresponding to different Arabidopsis accessions. We also generated 1240 contrasting root systems using ArchiSimple and quantified root system depth, (D) width (E), and directionality (F) using GLO-RIA. Example of a real (G) and ArchiSimple generated (H) root system and corresponding GLO-RIA determined directionality color-coded into the image (I, J). Absolute orientation angle values are taken before all calculations.