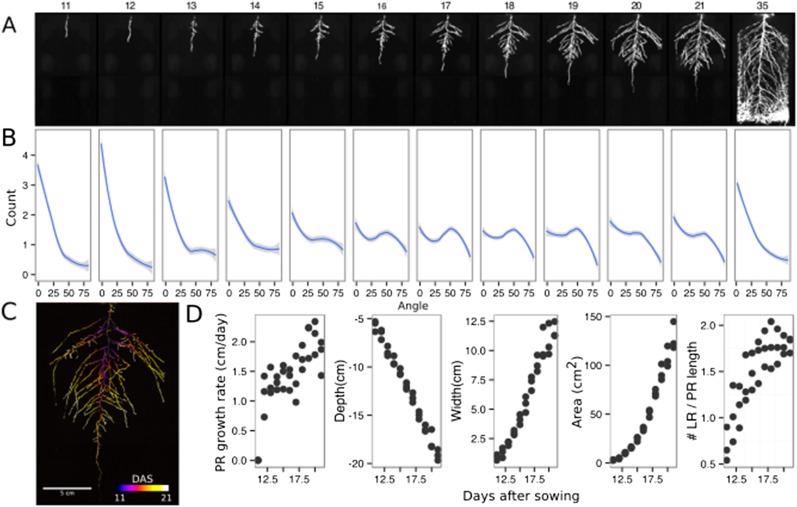
Figure 2. Time-lapse imaging of Arabidopsis root systems and quantification using GLO-RIA.
(A) Typical daily time-lapse image series from 11 to 35 DAS of a ProUBQ10:LUC2o Col-0 plant. (B) Average directionality of three root systems imaged in time series as in panel A calculated using the directionality plugin implemented in GLO-RIA. See the GLO-RIA ‘Materials and methods’ section for information of how the directionality is calculated. (C) Color-coded projection of root growth using the images in panel A. (D) Root system depth, width, root system area are automatically calculated from the convex hull, which is semi-automatically determined with GLO-RIA (n = 3). Primary root length, lateral root number and number of lateral roots divided by the primary root length were quantified manually. A local polynomial regression fitting with 95% confidence interval (gray) was used to represent the directionality distribution curve. 0° is the direction of the gravity vector.
DOI: http://dx.doi.org/10.7554/eLife.07597.017

