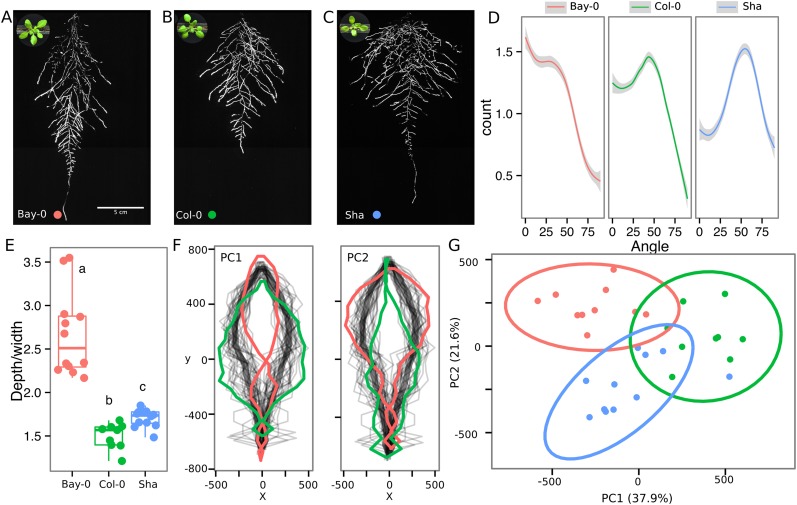
Figure 3. Variation in root architecture between accessions of Arabidopsis.
Representative root and shoot images of (A) Bay-0, (B) Col-0, and (C) Sha accessions transformed with ProUBQ10:LUC2o and imaged after 22 DAS. (D) Directionality of the root systems, (E) depth/width ratio, (F) pseudo-landmarks describing shape variation in root system architecture. Eigenvalues derived from the analysis of 9–12 plants per accession are shown. The first two principal components explaining 38% (PC1) and 22% (PC2) of the shape variation are plotted. PC1 captures homogeneity of root system width along the vertical axis and PC2 a combination of depth and width in top parts of the root system. Red and green lines indicate −3SD and +3SD (Standard Deviations), respectively. (G) PC separation of the different ecotypes using the PCs described in (F). A local polynomial regression fitting with 95% confidence interval (gray) was used to represent the directionality distribution curve. 0° is the direction of the gravity vector. Kolmogorov-Smirnov test at p < 0.001 showed significant differences in directionality distributions between all three accessions. Wilcoxon test analysis with p < 0.01 was used to test significant differences between the different accessions (n = 9–12 plants).
DOI: http://dx.doi.org/10.7554/eLife.07597.020


