. 2015 Aug 19;4:e07597. doi: 10.7554/eLife.07597

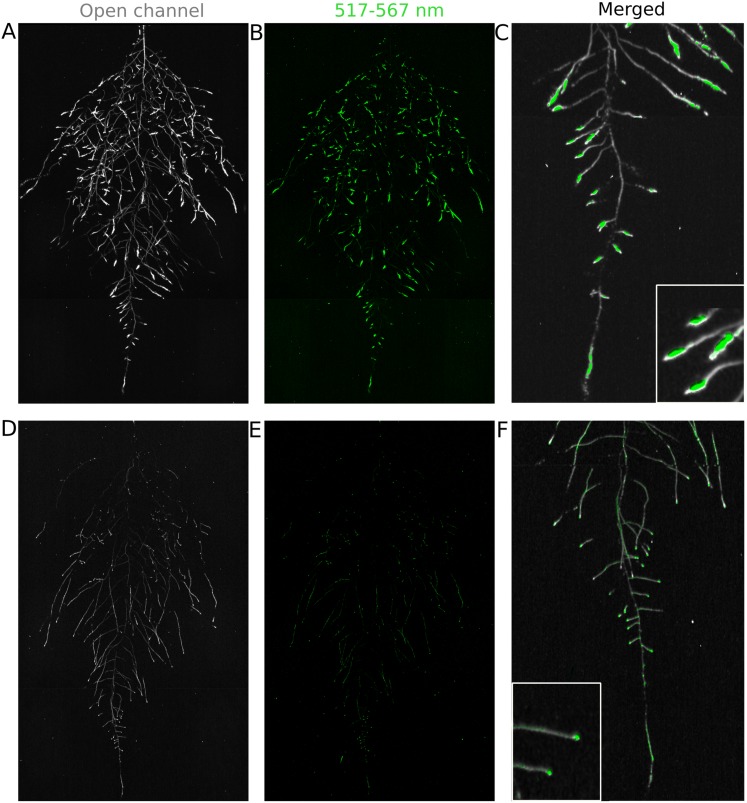
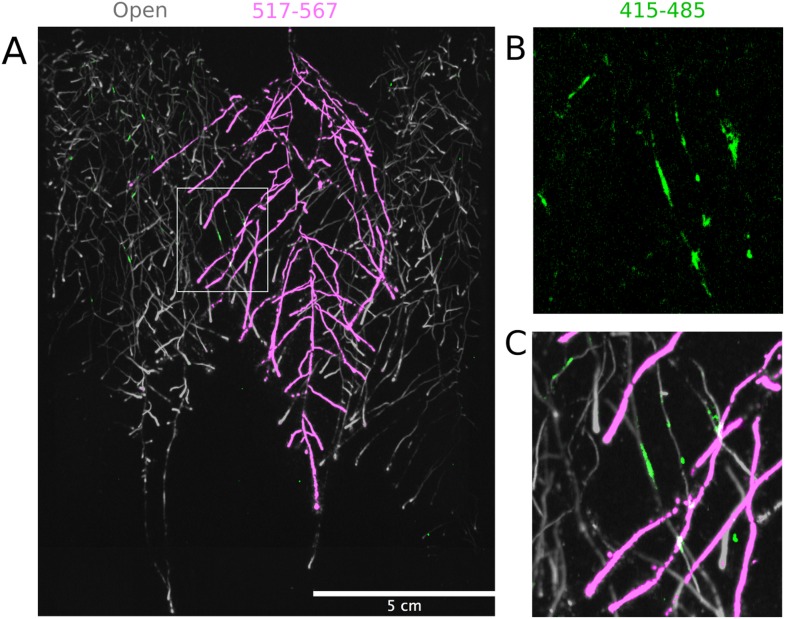
Figure 4. Dual-color reporter visualization of root structure and gene expression.

Images of whole-root systems (A, D) or magnified portion of roots (C, F) at 22 DAS expressing ProACT2:PPYRE8o and ProZAT12:LUC (green, A, B, C) or ProDR5rev:LUC+ (green, D, E, F). Luminescence from PPyRE8 and LUC reporters visualized together using an open filter setting (visualized in grey-scale) while LUC signal is distinguished using a band-pass filter (517 to 567 nm, visualized as green).

DOI: http://dx.doi.org/10.7554/eLife.07597.025

Figure 4—source data 1. Data for ProZAT12:LUC reporter gene expression in root segments extracted from a whole root system.
elife07597s011.xlsx (115.5KB, xlsx)
DOI: 10.7554/eLife.07597.026
Figure 4—source data 2. Luciferase intensity values from the root tip to maturation zone of ProUBQ10:LUC2o, ProZAT12:LUC and ProDR5:LUC+.
elife07597s012.csv (32.5KB, csv)
DOI: 10.7554/eLife.07597.027
Figure 4—source data 3. Distances to boundary between plants.
Shoot FW, root system architecture and shoot area of single and pairs of plants grown in the same rhizotron.
elife07597s013.csv (2KB, csv)
DOI: 10.7554/eLife.07597.028

Figure 4.

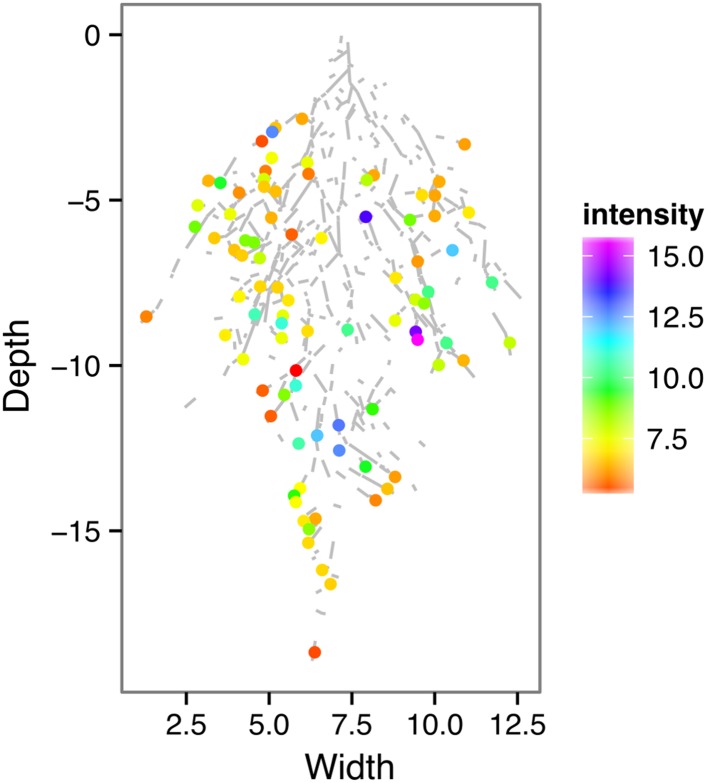
Figure 4—figure supplement 1. ProZAT12:LUC intensity and root segments automatically identified with GLO-RIA.

Figure 4—figure supplement 1.

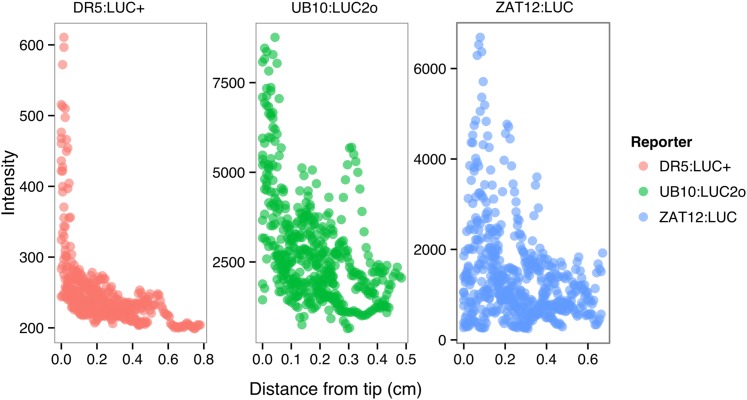
Figure 4—figure supplement 2. ProDR5rev:LUC+, ProUBQ10:LUC2o, and ProZAT12:LUC intensity values along the root tip.

Figure 4—figure supplement 2.

Data were manually obtained by measuring the intensity profile of the first 0.5 cm from the root tip of individual lateral roots. 10 lateral roots for each reporter were measured.
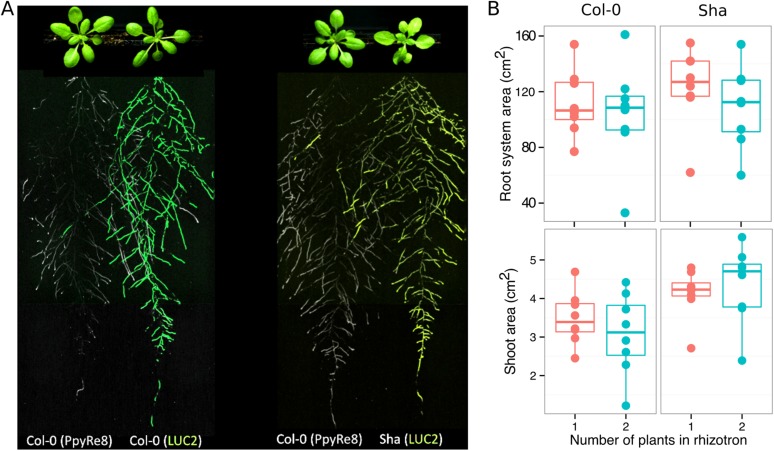
Figure 4—figure supplement 3. Images of plants at 22 DAS growing in the same rhizotron and expressing different luciferases.

Figure 4—figure supplement 3.

(A) Two Col-0 plants expressing ProUBQ10:LUC2o and ProACT2:PPyRE8o (B) Col-0 plant expressing ProACT2:PPyRE8o and Sha plant expressing ProUBQ10:LUC2o. Wilcoxon test analysis with p < 0.01 showed no significant differences between treatments (n = 7-8 plants).
Figure 4—figure supplement 4. Three reporter-based analysis of root–root–microbe interactions.

Figure 4—figure supplement 4.

(A) Image showing a 22 DAS ProUBQ10:LUC2o plant (magenta) grown in the same rhizotron with ProACT2:PpyRE8o plants (gray). Plants were inoculated with Pseudomonas fluorescens CH267 (green). Magnified portion of root systems colonized by P. fluorescens showing P. fluorescences (B) only or all three reporters together (C).