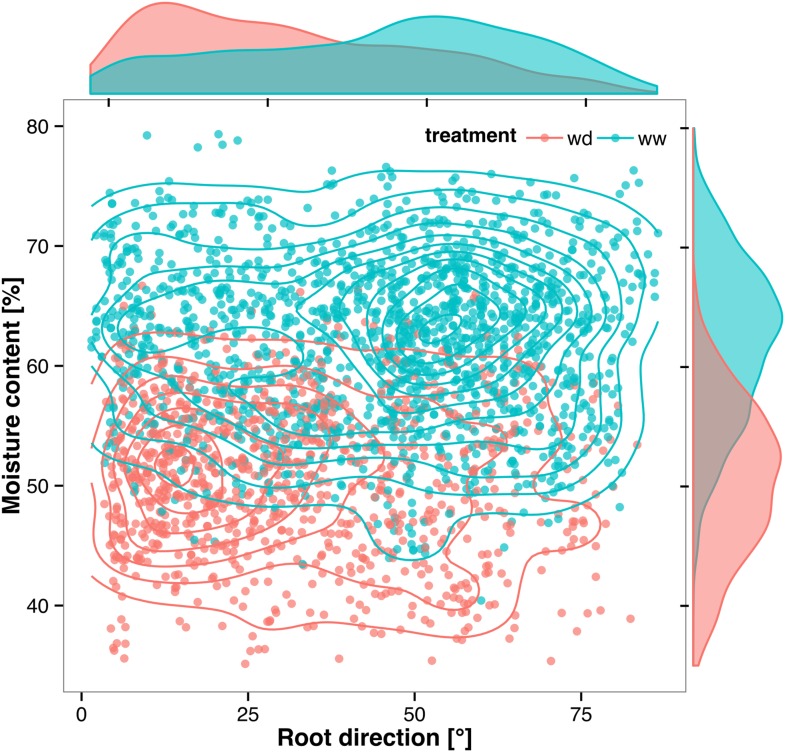
Figure 7. Relationship between local soil moisture content and root growth direction.
Data quantified from the time-lapse series are shown in Video 2. Density plots shown at periphery of graph for root direction (x-axis) and soil moisture (y-axis). 0° is the direction of the gravity vector. Data represent 2535 root tips measured in a series encompassing 10 time points.
DOI: http://dx.doi.org/10.7554/eLife.07597.049

