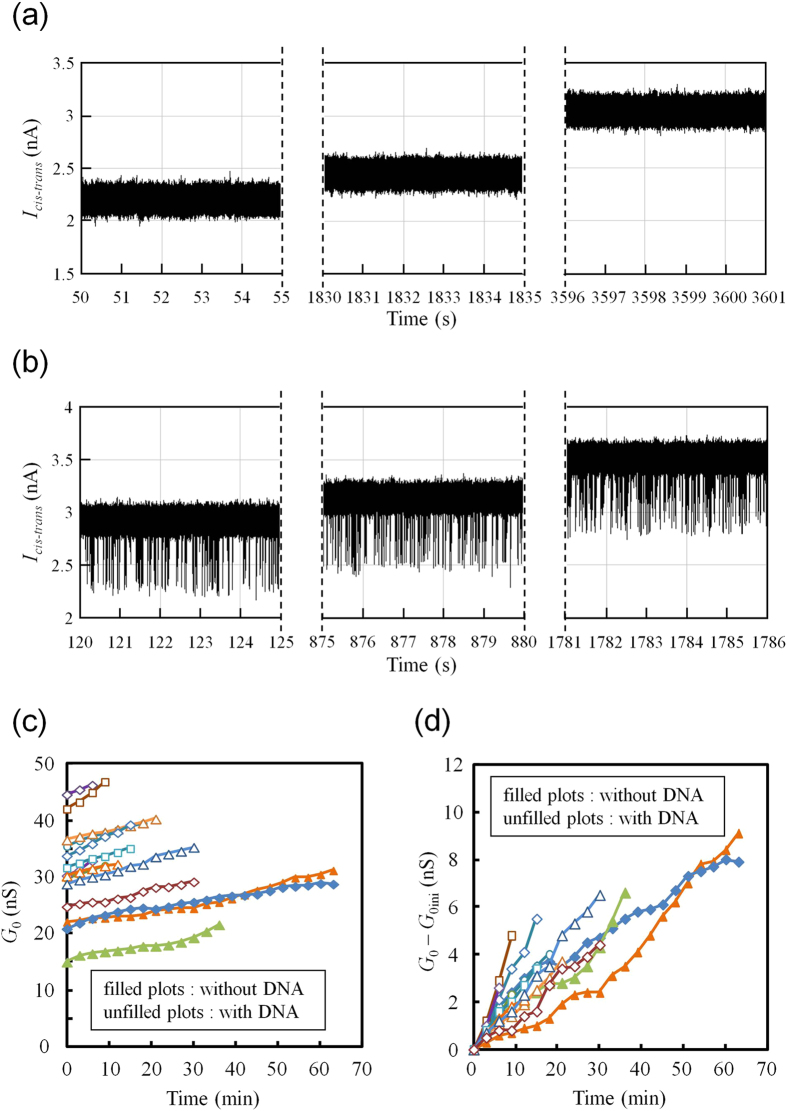
Figure 7. Long-term continuous measurement of current through nanopores.
(a) Continuous measurement of current through a nanopore at 0.1 V for one hour. Both cis and trans chambers were filled with 1 M KCl buffer solution. dsDNA was not applied. (b) Continuous measurement of current through a nanopore at 0.1 V for half an hour. The cis chamber was filled with 1 M KCl buffer solution with 20 nM 1 kbps dsDNA. The trans chamber was filled with 1 M KCl buffer solution. (c) Changes in baseline conductance (G0) with time. (d) Changes in G0 from the initial baseline conductance (G0ini). The current was plotted every 3 minutes.

