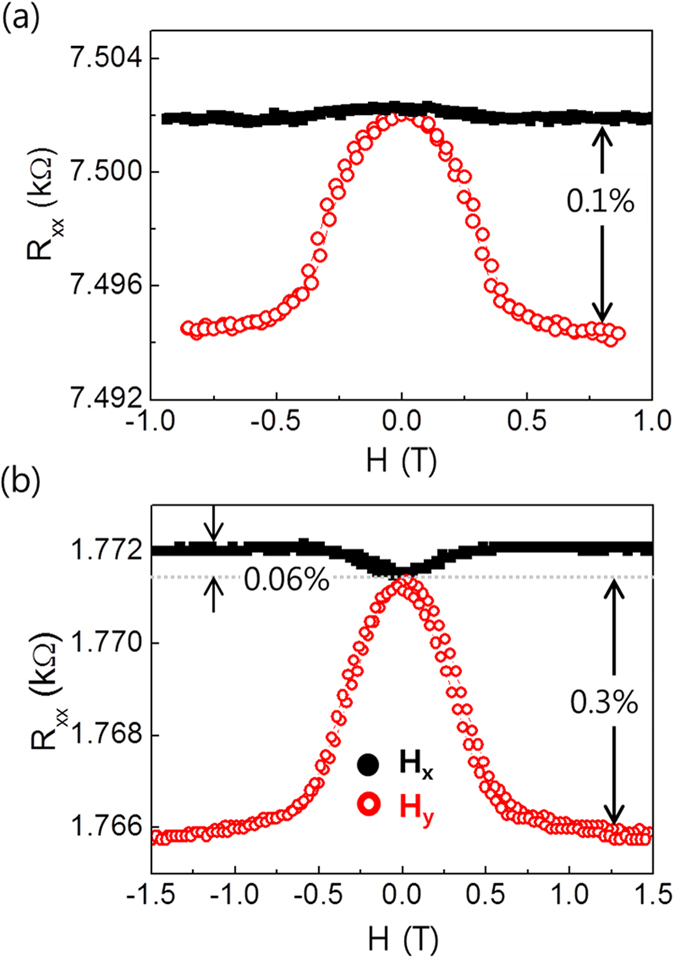
Figure 3. Longitudinal magnetoresistance (Rxx) for different NM underlayer.

(a) Ta(5 nm)/CoFeB(1 nm)/MgO(1.6 nm) and (b) Pt(3 nm)/Co(1 nm)/AlOx(1.5 nm) samples. The black solid (red open) circles represent the data for Hx (Hy).

(a) Ta(5 nm)/CoFeB(1 nm)/MgO(1.6 nm) and (b) Pt(3 nm)/Co(1 nm)/AlOx(1.5 nm) samples. The black solid (red open) circles represent the data for Hx (Hy).