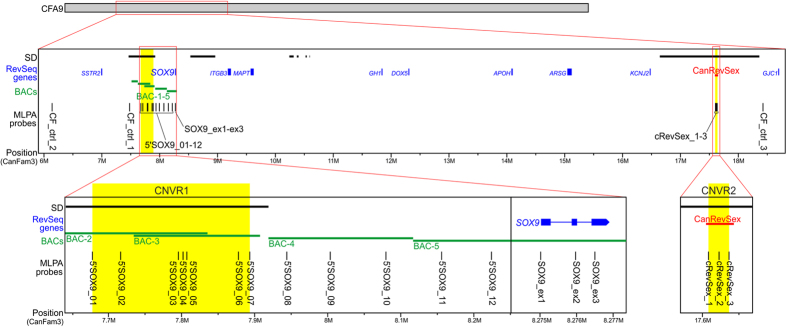
Figure 1. Map of the region studied.

From top to bottom are indicated: segmental duplication (SD) according to Nicholas et al.20, RevSeq genes (blue), FISH probes (green) and MLPA probes (black) with IDs indicated next to or below. The SOX9 with the upstream region and CanRevSex region are shown at higher resolution. Regions highlighted in yellow correspond to CNVRs detected in this study. The position of selected elements is indicated under the panels (please note that the scale is different for each panel).
