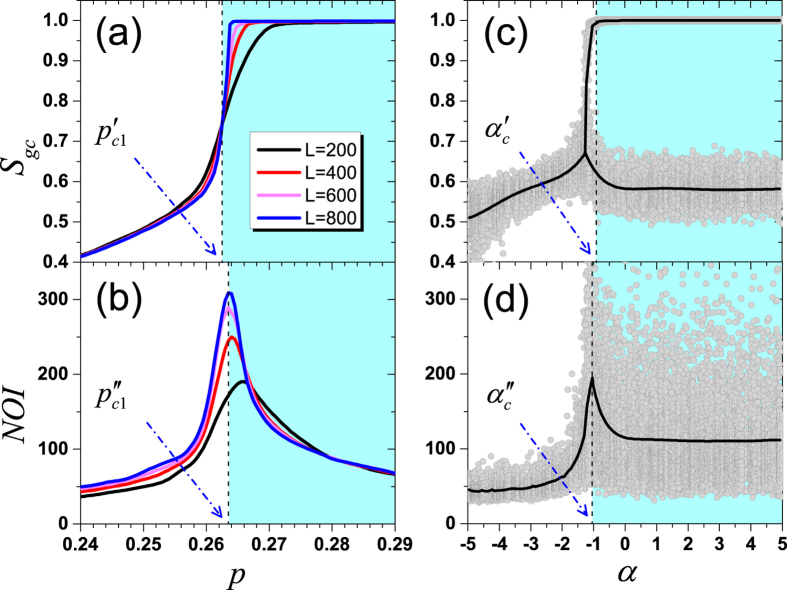
Figure 3. Cross-validation of pc1 and αc.
(a,b) are for Sgc and NOI under different network size L when α = −1, respectively. There is an intersection of Sgc(p) at  , while NOI reaches its maximum at
  when L = 800. Thus, pc1 is identified as the average value 0.263. (c,d) are for Sgc and NOI when p = 0.263 under different α, respectively. For
  , Sgc has two phases, and NOI reaches its maximum at
  . Thus, αc is identified as the average value −1. In (c,d), dark curves respectively represent the average values of Sgc and NOI, obtained from 1000 realizations, and each data point stands for one realization.

