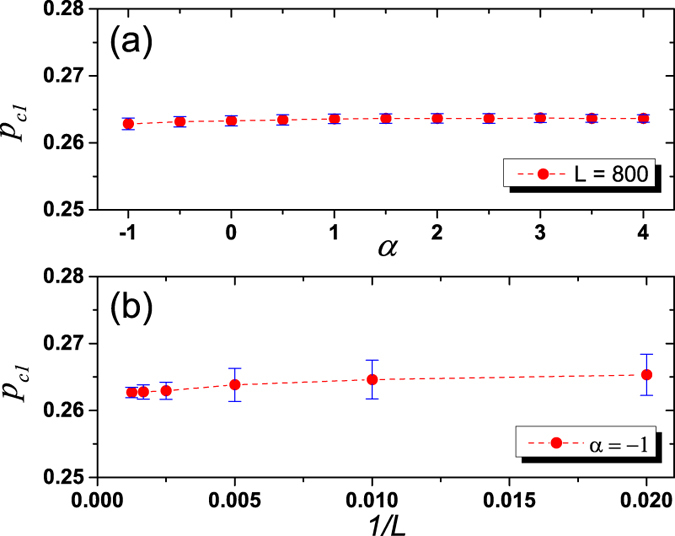
Figure 4. Error estimation and effects of finite-size.

(a) Error estimation of pc1 with fixed network size L = 800. As α approaches the critical value −1, pc1 slightly decreases, but being kept in a very narrow range. When α is in range [−1,4], the mean value of pc1 is 0.2634, and the difference between maximum and minimum value of pc1 is 0.0008. (b) Analysis on the effects of finite-size. The data point and the error bar are respectively mean value and standard deviation of the identified pc1 in the case of α = −1 under different network sizes L. As L goes to infinity (from the right side to the left side in (b)), the mean value of pc1 gradually approaches an extreme value around 0.263, and the standard deviation of the pc1 decreases. Results are obtained by averaging over 1000 realizations.
