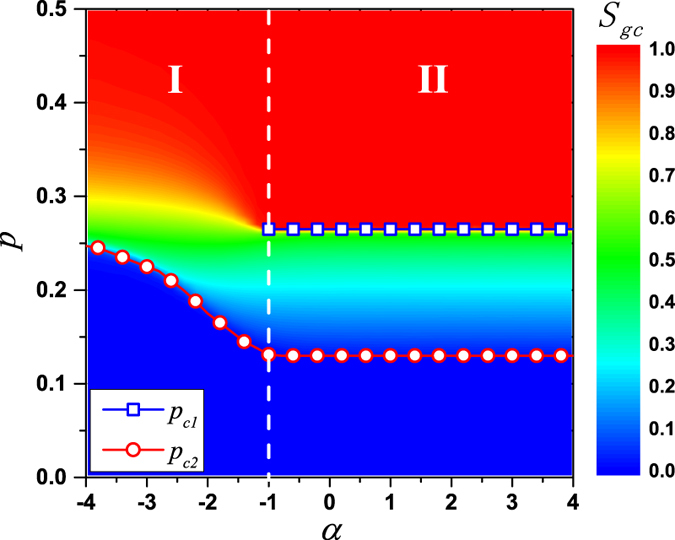
Figure 5. Phase diagram of k = 3 bootstrap percolation in the p − α plane.

The color marks the value of Sgc. Dashed lines with solid squares and circles represent pc1 and pc2, respectively. Separated by α = −1, a double phase transition is observed in the right region II with two almost constant critical points  and
and  . In the left region I, only a second-order phase transition is present with an increasing critical point as α decreases. The critical point is up to
  , which is obtained in the case of all long-range links’ lengths are 2. Results are averaged over 1000 realizations with fixed network size L = 400.
