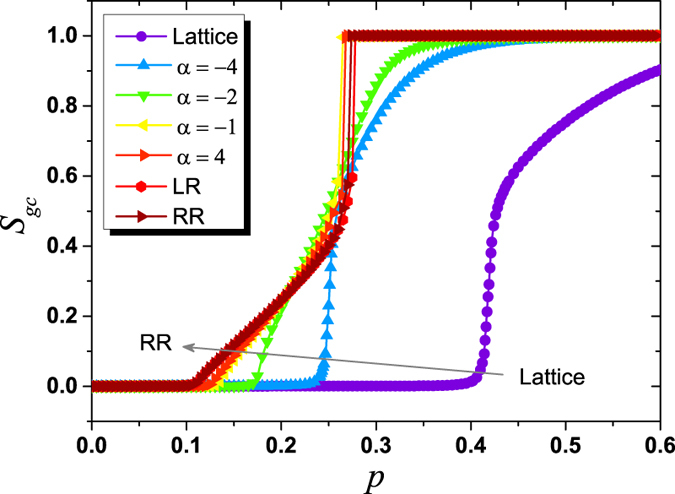
Figure 7. Sgc as a function of P after k = 3 bootstrap percolation on different networks, including Lattice, LR, RR and the present spatial networks with different α.

When α = −4, the curve of Sgc(p) on the spatial network behaves like the one on Lattice network, and the transition is of second-order. As α increases, the transition turns into a double phase transition when α ≥ −1, where the curves of Sgc(p) are almost overlapped with the ones on LR network and RR network. The parameter for LR network is set as α = −1. Results are averaged over 1000 realizations with fixed network size L = 400.
