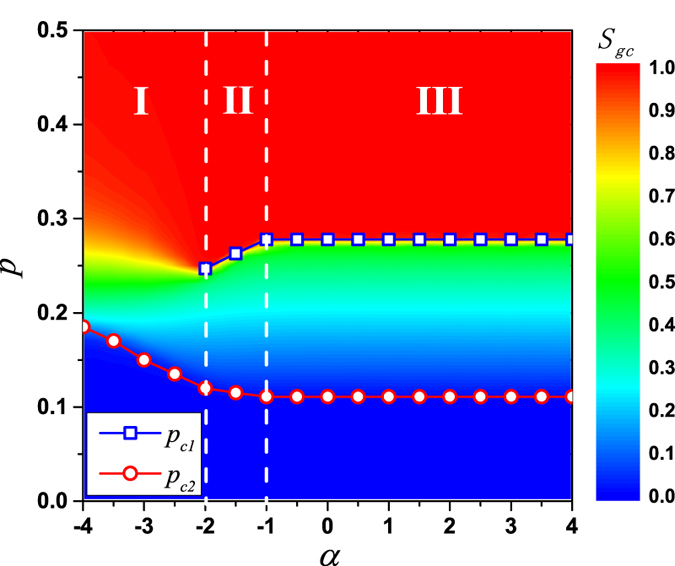
Figure 8. Phase diagram of k = 3 bootstrap percolation in the p − α plane on LR networks with kl = 5.

The color marks the value of Sgc. When α decreases, the transition is of second-order with an increasing pc2 in the region I where α < −2. When α decreases, a double phase transition is observed in the region II where −2 ≤ α < −1, with a decreasing pc1 for the hybrid phase transition and an increasing pc2 for the second-order phase transition. In the region III where α ≥ −1, the double phase transition has two almost constant critical points, pc1 = 0.278 and pc2 = 0.111. Results are averaged over 1000 realizations with fixed network size L = 400.
