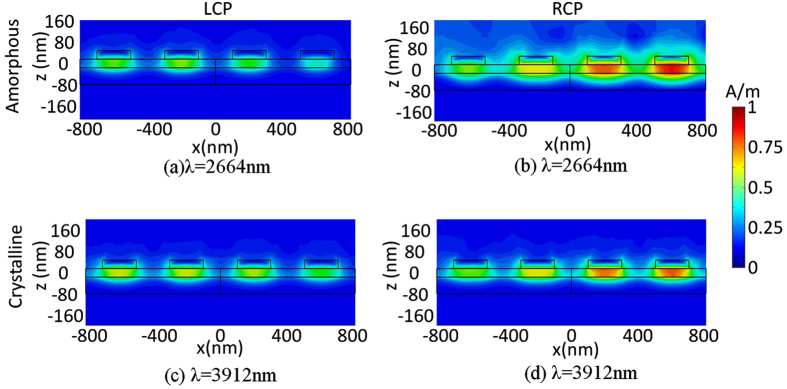
Figure 4. Map of the normalized total magnetic field intensity (H) distribution along the plane β:

resonance wavelength at 2664 nm for amorphous Ge2Sb2Te5 under (a) LCP incidence, (b) RCP incidence with θ = 75°, φ = 60°; resonance wavelength at 3912 nm for crystalline Ge2Sb2Te5 under (c) LCP incidence, (d) RCP incidence with θ = 75°, φ = 60°.
