
Figure 5. Photobleaching in Sample #1 in regular confocal microscopy (zero depletion).
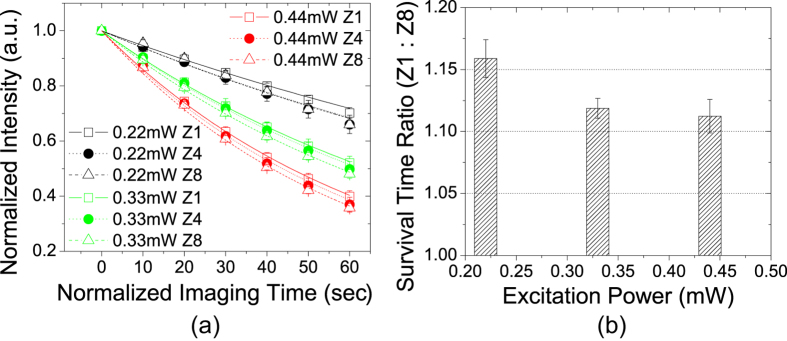
(a) Image intensity decay curves fitted to Eq. (3). (b) Ratio of survival time between Zoom 1 and Zoom 8 as a function of excitation power. Fluorophore survival time is similar at all 3 zooms. Difference is at most ~15% with the lowest excitation power. At higher excitation power, the difference further diminishes.