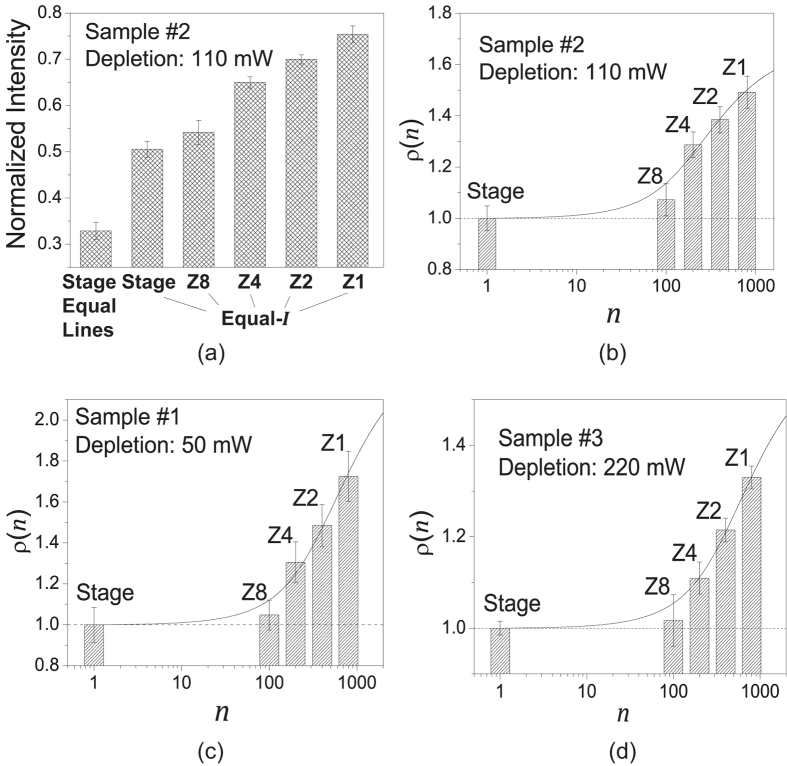
Figure 7. Photobleaching rates of piezo-stage and resonant scanning in STED microscopy.
(a) Normalized image intensity of the 2nd image in the time series for Sample #2. Under the equal-irradiance condition (pixel size 110 × 100 nm), piezo-state caused about the same photobleaching as resonant scanning at Zoom 8, despite its exposure time-span is 100-fold longer. Under the equal-lines condition (pixel size 15 × 15 nm), piezo-stage resulted in much more severe photobleaching. (b–d) show fluorescence gain ratio  with respect to piezo-stage scanning as a function of exposure divisor n, under the equal-irradiance condition for Sample #2, Sample #1 and Sample #3, respectively. Data points (columns) were fitted to
  expressed in Eq. (4) (solid lines). Fitted parameters are listed in Table 2.

