
Figure 6. Line scans of corresponding transversal and axial intensity distributions of Fig. 5(c).
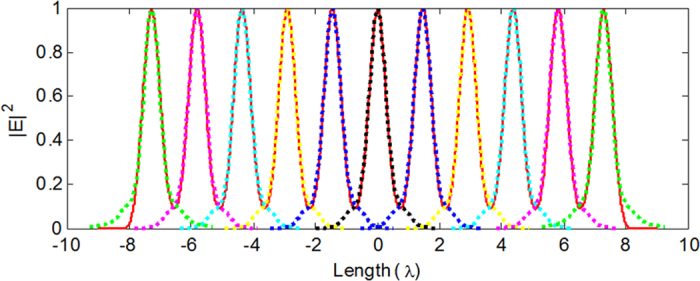
The dashed lines denote the transversal line scans of 11 spots, and the solid red line denotes the axial line scan.
Official websites use .gov
A
.gov website belongs to an official
government organization in the United States.
Secure .gov websites use HTTPS
A lock (
) or https:// means you've safely
connected to the .gov website. Share sensitive
information only on official, secure websites.
The dashed lines denote the transversal line scans of 11 spots, and the solid red line denotes the axial line scan.