
Figure 7. 2D contour plots.
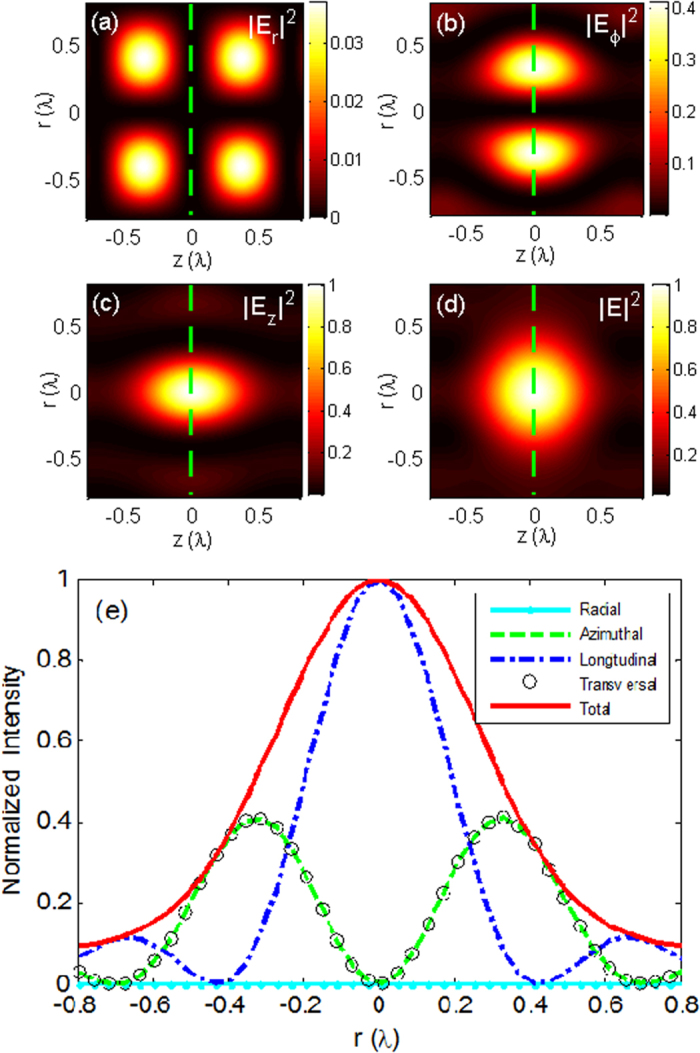
(a) The radial component |Er|2, (b) the azimuthal component |Eϕ|2, (c) the longitudinal component |Ez|2, and (d) the total intensity |E|2 in the r–z plane for the center spot given in Fig. 5(c). Line scans of corresponding intensity distributions in the focal cross section, as marked by the dashed lines in Fig. 7(a–d), are presented in Fig. 7(e).