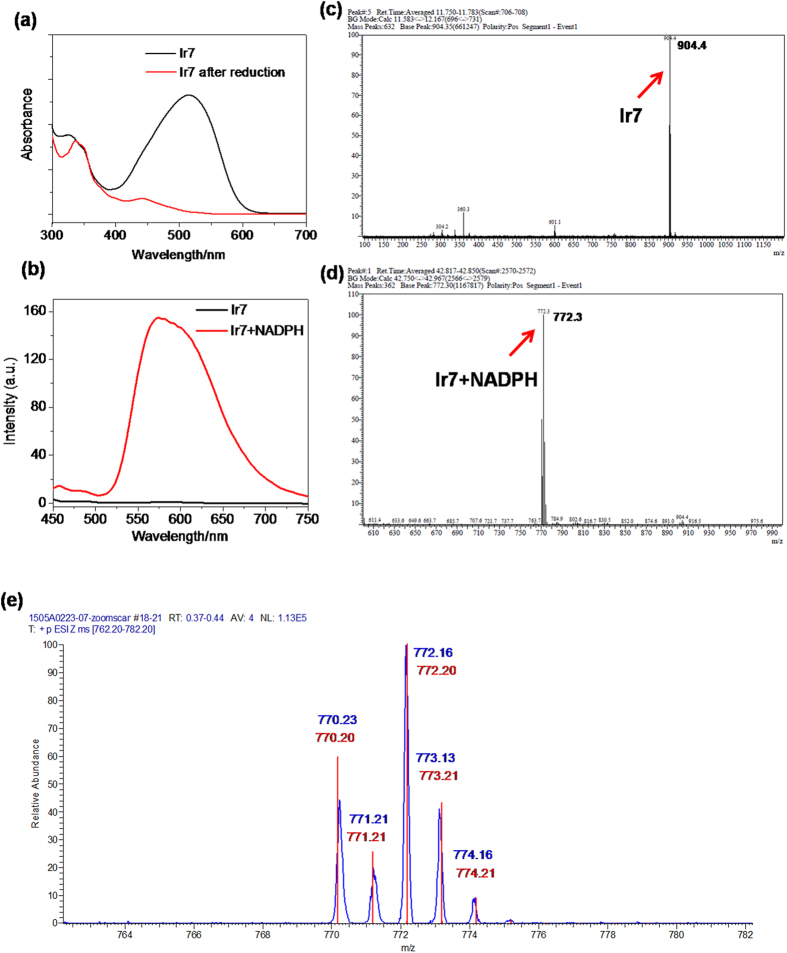
Figure 5.
UV-Vis (a) and emission (b) spectral changes of Ir7 in the presence of rat liver microsomes (0.25 mg protein/mL)/NADPH (50 μM) under normoxic (black) or hypoxic (red) conditions. Excitation wavelength: 405 nm. Both ex/em slits were set to 10 nm. (c–e): ESI-MS analysis of the reaction mixture generated by Ir7; (c) ESI-MS spectrum of Ir7. (d) ESI-MS spectrum of the product of Ir7 after incubation with rat liver microsomes/NADPH at 37 °C for 30 min. (e) Zoom scan MS spectra of iridium isotope peaks of (d) and the simulation of IrNH23.

