
Figure 1.
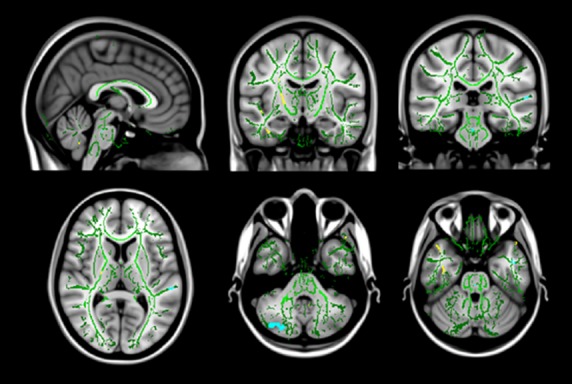
Changes in FA values in patients with RLS. Coronal, axial, and sagittal view of the mean b0 image with the overlayed common white matter skeleton (green), showing areas of significantly (P < 0.0001) increased (yellow) and decreased (blue) fractional anisotropy.