Figure 1.

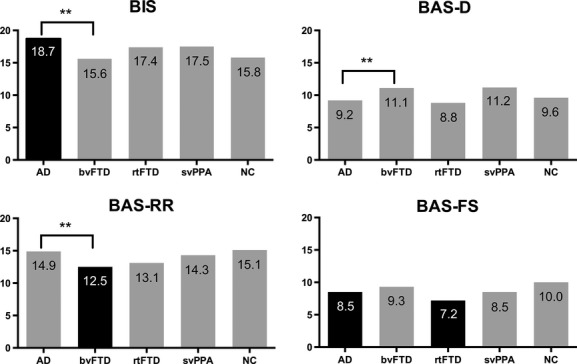
BIS/BAS score of each diagnostic groups. Significance is denoted by **P < 0.01. Black bar denotes significant (P < 0.01) difference from the normal control group.

BIS/BAS score of each diagnostic groups. Significance is denoted by **P < 0.01. Black bar denotes significant (P < 0.01) difference from the normal control group.