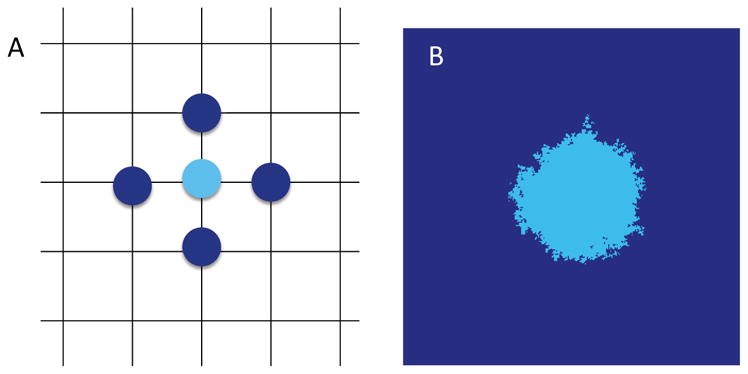
Figure 1. Lattice dynamics.

(A) Schematic of spatial Moran model in d = 2: each cell divides at rate according to its fitness and replaces one of its 2d neighbors: if the light blue cell divides, its offspring replaces one of the dark blue neighbors, chosen uniformly at random. Every lattice site is occupied at all times (not shown). (B) Simulation example of the model: growth of an advantageous clone (light blue) starting from one cell with fitness advantage s = 0.2 over the surrounding field (dark blue).
