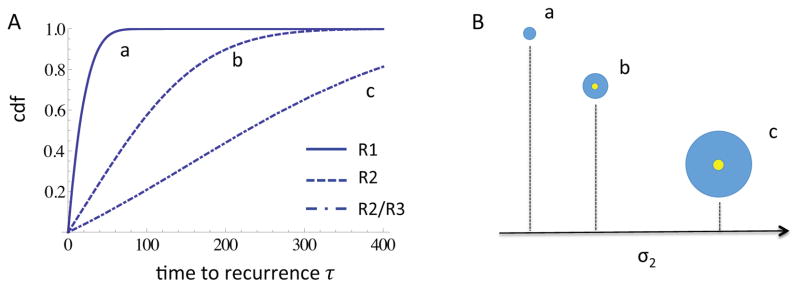
Figure 10. Time to local recurrence.

A The cumulative distribution function of the time to recurrence of a second field tumor is shown for three different scenarios, corresponding to u2 = 2 · 10−3 (Regime 1), u2 = 2 · 10−5 (Regime 2) and u2 = 2 · 10−3 (Regime 2/3), respectively. The remaining parameters are d = 2, N = 2·105, u1 = 7.5·10−7, s1 = s2 = 0.1, t = E(σ2). B Schematic of the relative initiation times of the primary tumor (yellow) and sizes of the local fields (blue), for the three scenarios in panel A. The numerical values for expected initiation time and local field size are: (a)
 (σ2) = 123, Ê(Rl) = 8; (b)
 (σ2) = 281, Ê(Rl) = 31; (c)
 (σ2) = 474, Ê(Rl) = 55.
