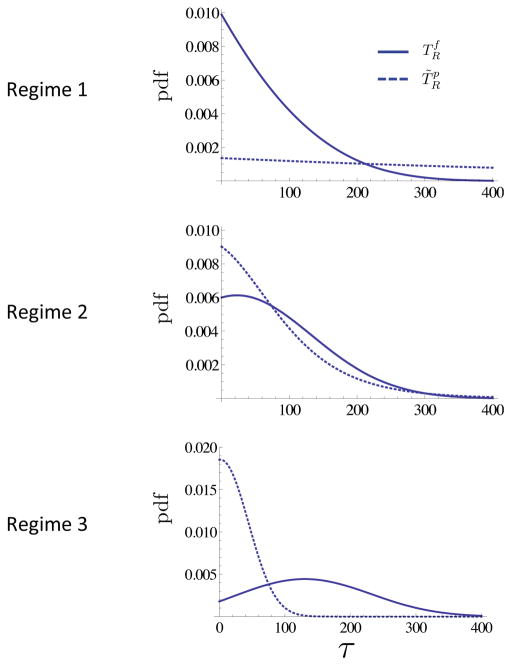
Figure 11. Local vs. distant recurrence.
A For each of the three regimes in Figure 5, we show: the distribution of time to local recurrence , and the distribution of time to distant recurrence . The distribution of is given in Corollary 4.1 and we set to account both for contributions from type-1 clones already existing at σ2 as well as contributions from type-1 clones born after σ2 (for which time to recurrence is distributed as σ2). Expected times to recurrence: and (Regime 1); and (Regime 2); and (Regime 3). The parameter values are as in Figure 5.

