
Figure 3. Simulations of clonal expansion rate for large s.
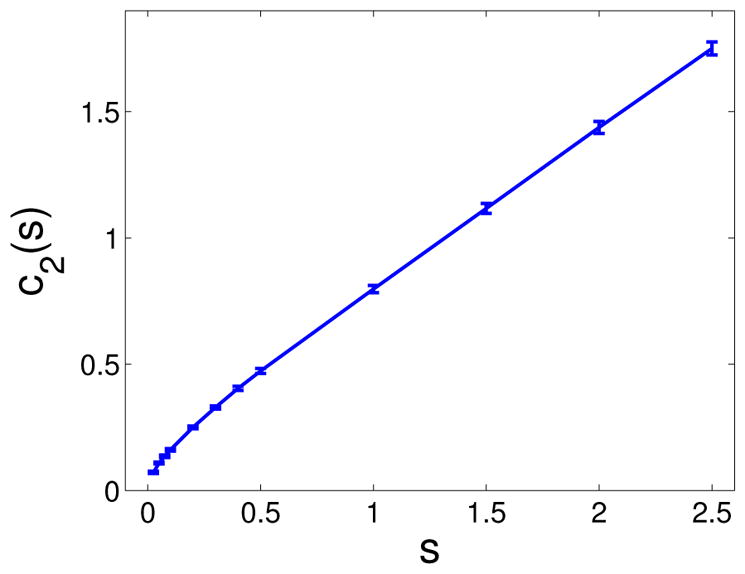
Dependence of the growth rate c2 on the fitness advantage s. Statistics performed on M = 100 samples for each s-value. The error bars represent 95% confidence intervals.
Official websites use .gov
A
.gov website belongs to an official
government organization in the United States.
Secure .gov websites use HTTPS
A lock (
) or https:// means you've safely
connected to the .gov website. Share sensitive
information only on official, secure websites.
Dependence of the growth rate c2 on the fitness advantage s. Statistics performed on M = 100 samples for each s-value. The error bars represent 95% confidence intervals.