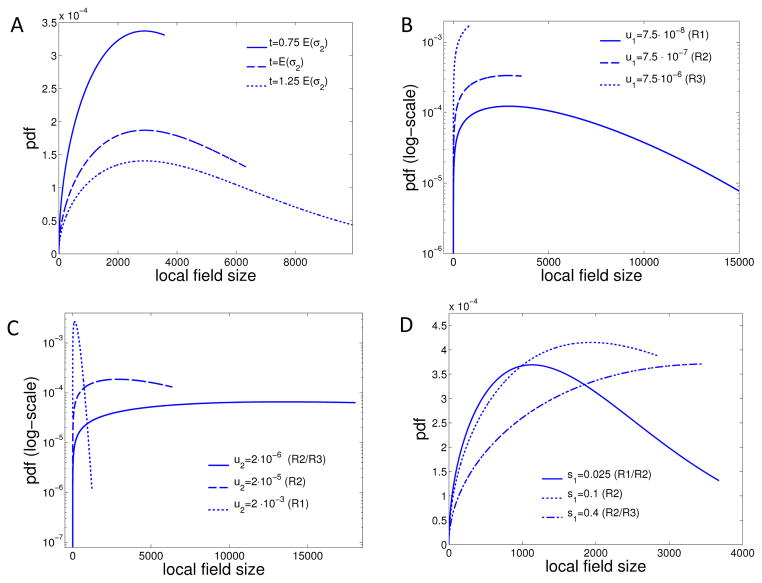
Figure 7. Size-distribution of local field.
The size-distribution (8) of the local field is shown for different scenarios, corresponding to different Γ-values and regimes R1, R2 and R3 as explained in Section 2.4. A For varying arrival times t; B for varying type-1 mutation rates u1; C for varying type-2 mutation rates u2; (D) for varying type-1 fitness advantages s1. The non-varying parameters are held constant at d = 2, N = 2 · 105, u1 = 7.5 · 10−7, u2 = 2 · 10−5, s1 = s2 = 0.1 and c2(s1) = 0.16.

