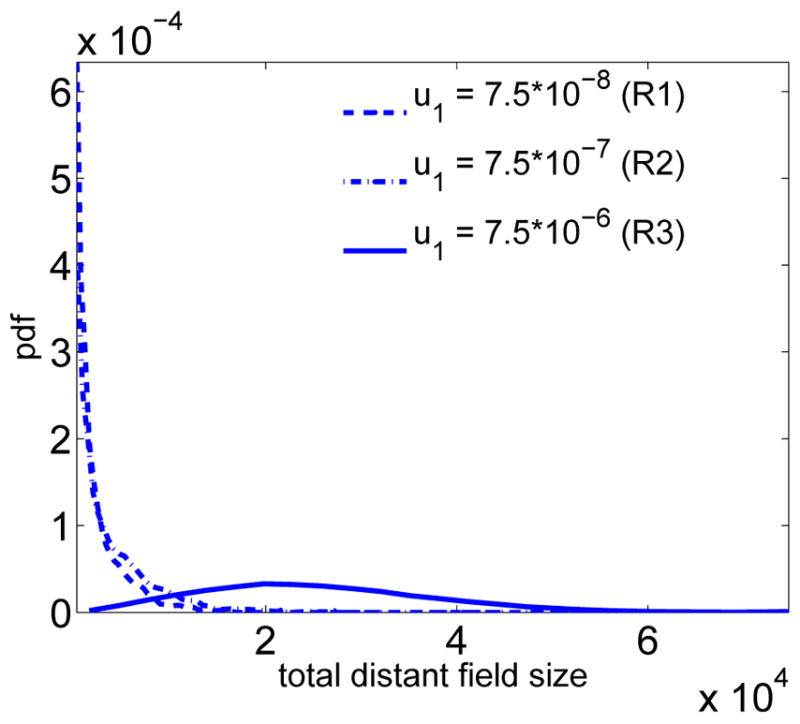
Figure 8.

The distribution of the total size of the distant field is shown for different scenarios, corresponding to the three regimes R1, R2 and R3 illustrated in Figure 4 for varying type-1 mutation rates u1. The non-varying parameters are held constant at d = 2, N = 2 · 105, u2 = 2 · 10−5, s1 = s2 = 0.1 and c2(s1) = 0.16.
