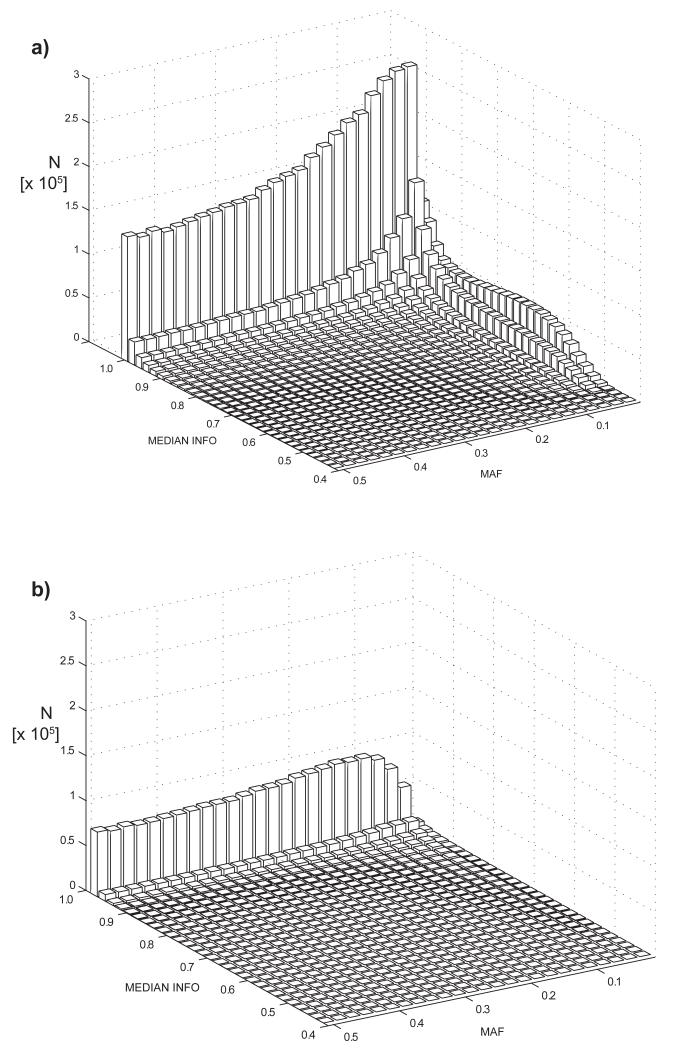
Figure 1.
Spectrum of minor allele frequencies (MAF) and median imputation quality (MEDIAN INFO) showing the number (N) of variants in each bin (a) shows the distribution for the 9.4M 1000 Genomes phase1v3 variants (b) shows the distribution for 2.5M HapMap2 SNPs. Imputation quality was calculated as the median of the respective values in up to 48 contributing studies; the imputation quality for genotyped variants was set equal to 1.0. The 1000 Genomes training set included more low frequency variants, many of which have imputation qualities > 0.9.

