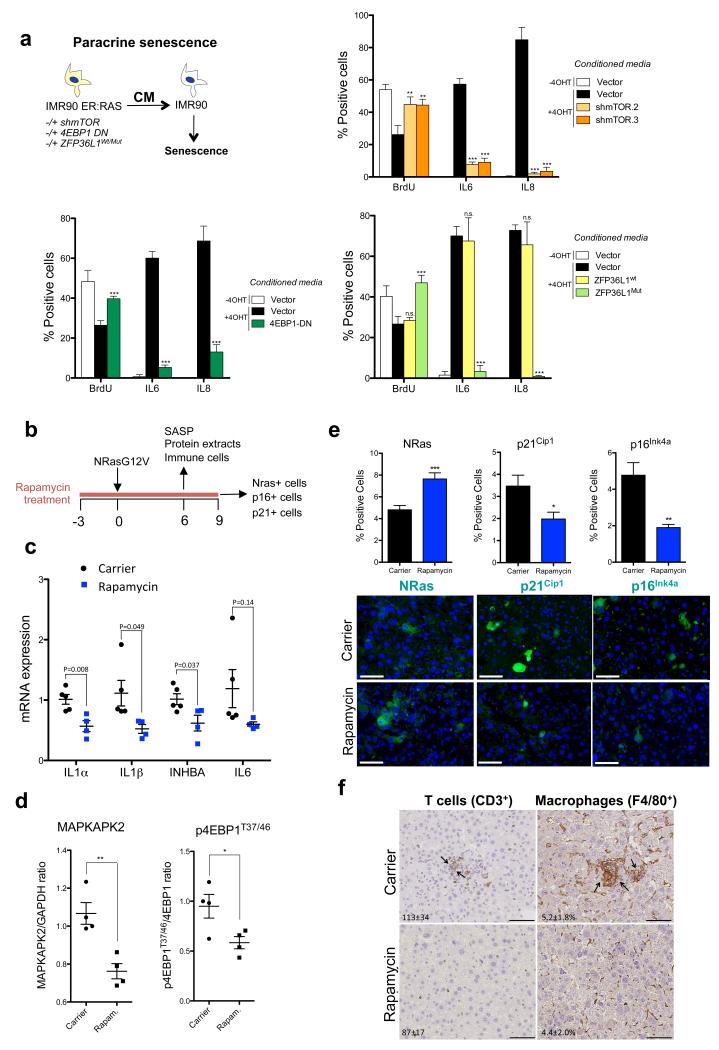
Figure 8. mTOR inhibition blunts the tumour suppressive effects of the SASP.
a. (top left) Diagram summarizing the paracrine senescence/conditioned media experiments. CM of the indicated cells was collected 7 days after incubation with 4OHT. The effect of CM on BrdU incorporation and SASP induction in IMR90 wt cells was evaluated by IF (n=4 independent experiments). (top right) IMR90 ER:RAS shmTOR (bottom left) IMR90 ER:RAS cells expressing 4EBP1-DN (bottom right) IMR90 ER:RAS cells expressing ZFP36L1wt/ZFP36L1Mut. b-f. Treatment with rapamycin reduces the SASP, senescence and immune clearance in vivo. (b) NrasG12V transposons and a transposase were co-delivered into mouse livers through hydrodynamic injection (Day 0). Mice were treated with carrier or drugs from day −3 (3 days before NrasG12V injection) and sacrificed 6 or 9 days post-injection depending on the experiment. (c) Quantification of the expression of SASP components by qRT-PCR in livers of the indicated mice 6 days after NrasG12V injection. Carrier, n=5 mice; rapamycin, n=4 mice. P values are included. (d) MAPKAPK2 expression and 4EBP1 phosphorylation were analysed by immunoblot (see Supplementary Fig. S8d) and further quantified. MAPKAPK2 levels were normalised to GAPDH expression and 4EBP1 phosphorylation (p4EBP1T37/T46) was referred to normalised 4EBP1. Mice livers were obtained 6 days after NrasG12V induction. (n=4 mice per condition). (e) Quantification of Nras+ (left), p21Cip1+ (centre) and p16Ink4a+ (right) cells on liver sections 9 days after NrasG12V injection (n=5 mice per condition). Representative images of the sections quantified in the top panel are shown in the bottom. Scale bar, 40μm (f) Liver sections were collected 6 days after NrasG12V injection and stained for the CD3 (T cell marker) and F4/80 (macrophage marker). (Carrier n=5 mice, rapamycin n=4 mice; 200x). Arrows indicate clusters of infiltrating immune cells, which suggest clearance of senescence hepatocytes. Quantification of positive cells/mm2 (CD3+ T cells) or % of positive area (F4/80+ macrophages) is included in the images. Scale bar, 50 μm. All statistical significances were calculated using two-tailed Student’s t-test, *** P < 0.001; ** P < 0.01; *P < 0.05; n.s, non significant. All error bars represent means ± s.d. For raw data, see Supplementary Table 7.

