Figure 3.
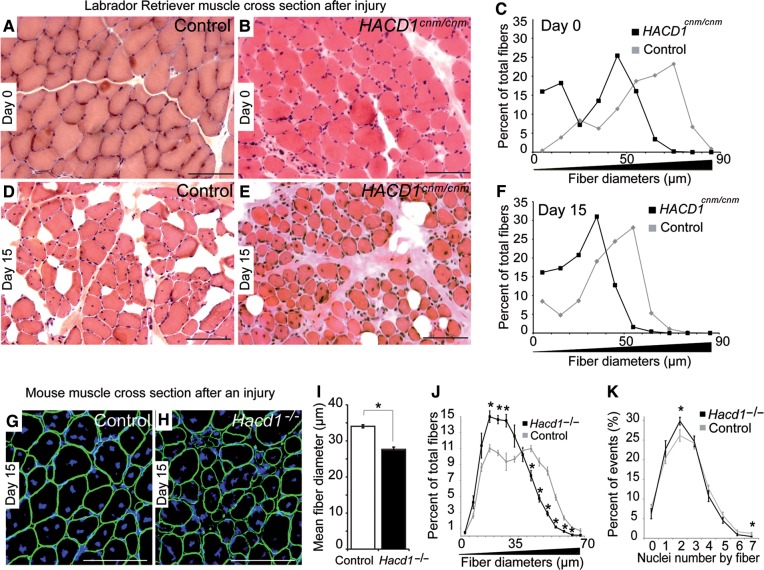
Defective myoblast fusion in HACD1-deficient dogs and mice. H&E-staining of muscle transverse sections before (A and B) and on Day 15 after notexin injection (D and E) in control (A and D) and HACD1cnm/cnm (B and E) dogs. Scale bar, 200 μm. (C and F) Percent distribution by diameter (μm) of myofibres from dog muscles before (C) and on Day 15 after notexin injection (F) (n = 1 for each genotype; ≥730 fibres examined per dog). (G and H) Immunofluorescence for Dystrophin (green) on TA sections on Day 15 after notexin injection in control (G) and Hacd1−/− (H) mice. Nuclei are in blue. Scale bar, 100 μm. (I) Mean fibre diameter in TA muscles on Day 15 after notexin injection in control and Hacd1−/− mice (n = 3 and 4, respectively; ≥1780 fibres per mouse). (J) Percent distribution by diameter (μm) of myofibres analysed in I. (K) Nuclear content of fibres (n = 3 for each group; ≥600 fibres per mouse). Error bars correspond to standard error of the mean. *P < 0.05, **P < 0.01, ***P < 0.001.

