Fig. 2.

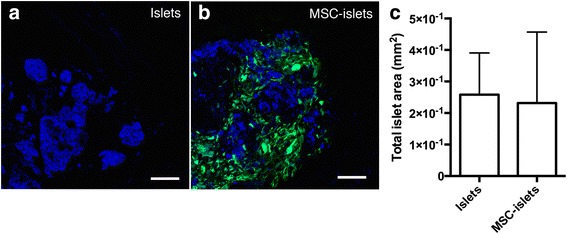
Analysis of the islet graft size. a Control islet (blue) graft in the muscle tissue on day 7 post transplantation in comparison to (b) MSC-islet graft, where the islets (blue) are surrounded by MSC (green). c Quantification of the islet mass in the graft area of control islets and MSC-islets. Bars = 100 um
