Fig. 3.

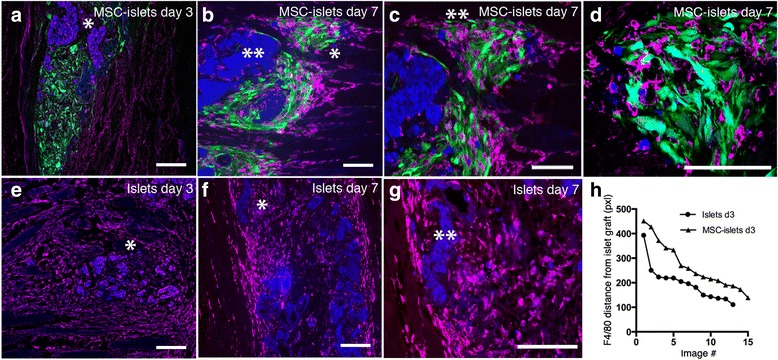
Accumulation of inflammatory cells within the graft area. a The MSC (green) intermingled with F4/80+ expressing macrophages (purple) close to the islet mass (blue,*) at 3 days post transplantation. b MSC interacting (green,*) with F4/80+ macrophages (purple) at distance from the islet graft (blue,**) at 7 days post transplantation. c Increased magnification of Fig. 2b showing the interactions between F4/80+ expressing macrophages and MSC. d Close up of the MSC-F4/80 region in Fig. 3c shows MSC intermingling with the macrophages. e Infiltrating F4/80+ expressing macrophages (purple) into control islet mass (blue,*) 3 days post transplantation. f The infiltration of F4/80+ macrophages (*) into the islet graft increased even further upon day 7. g Increased magnification of the infiltrated area in Fig. 3f. h Distance of F4/80 positive cells relative to the islet graft in MSC-islets (n = 4, black triangles) compared to control islet grafts (n = 3, black circles) in analyzed images of the investigated animals. Bars = 100 um
