
Figure 3 .
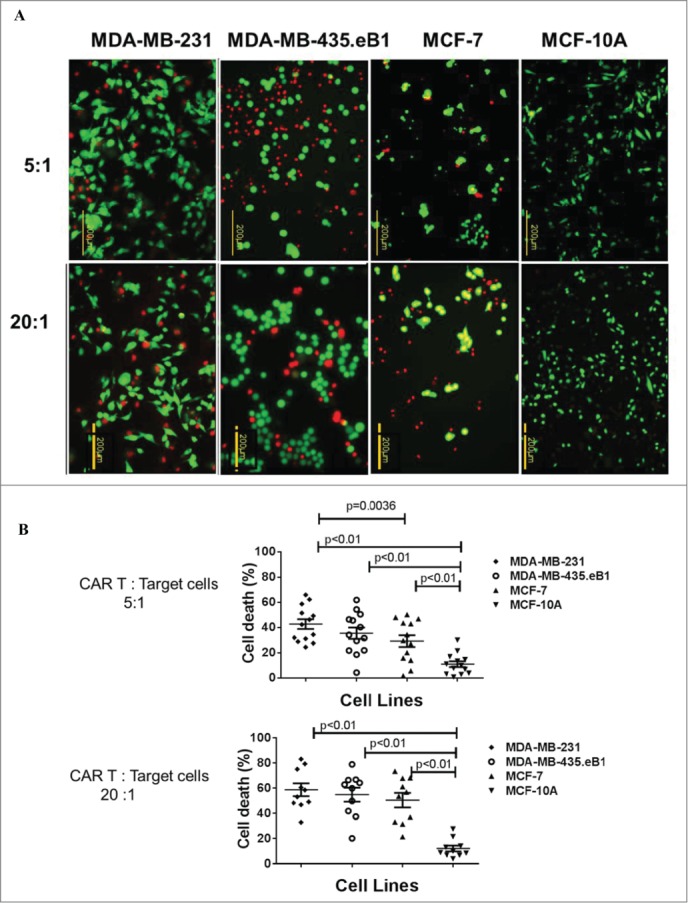
Specificity of cell death assay of K-CAR. (A) Target cells were loaded with K-CAR (5:1 ratio of K-CAR T cells to target cells, top panel; or 20:1 ratio, bottom panel) for 4 h. Live cells (green color) and putative dead cells (red color) were identified using the co-stained Live/Dead Viability Assay. EthD-1 penetrates cells with membrane damage and binds to nucleic acids to produce red fluorescence in dead cells. (B) Significantly greater numbers of dead cells were found in K-CAR-treated BC cells compared with MCF-10A after random counts of eight fields per well. Cell death was greatest in BC cells that had higher expression of HERV-K env protein (MDA-MB-231>MDA-MB-435.eB1>MCF-7>MCF-10A). (C) Cell viability was also analyzed by FACS. The percentage of dead target cells increased with the ratio of K-CAR T cells to target cells for patient 257 (Fig. 3C) or ND8 (Fig. 3D), but not with the ratio of PBMC (Fig. 3C) or control T cells (Fig. 3D) to target cells. Primary tumorspheres grown from a tumor biopsy of patient 78 were used as target cells in Fig. 3D (right panel). Target cells treated with 0.3% Triton X-100 detergent were used as positive controls for cell death.
Figure 3.

(Continued)