Figure 3.
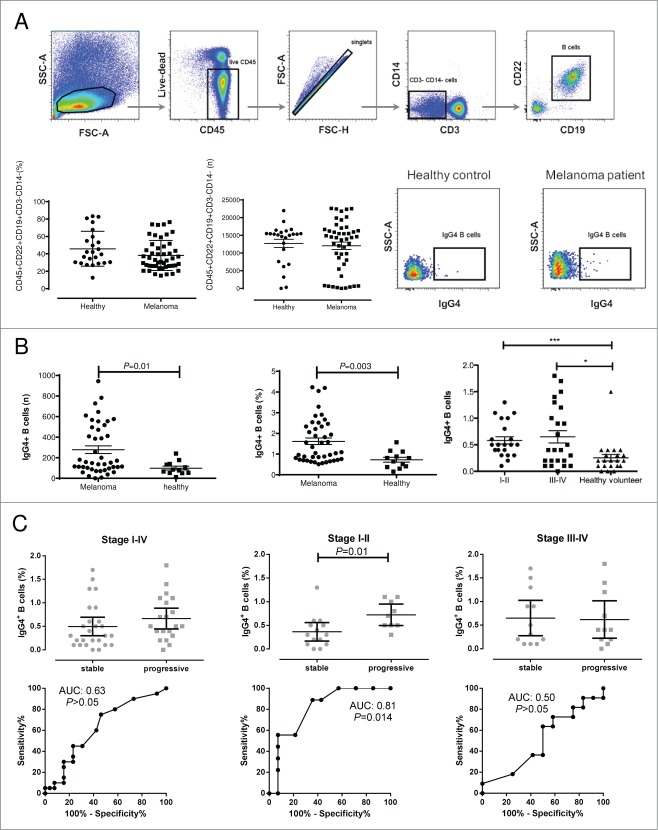
For figure legend, see next page.Figure 3 (See previous page). Increased frequencies of peripheral blood IgG4+ B cells from melanoma patients compared to healthy volunteers. (A) Representative cytofluorimetric dot plots and flow cytometry gating strategy for evaluation of the circulating IgG4+ B cell compartment. Lymphoid cells were gated according to their FSC-A and SSC-A properties and viable CD45+ were selected and cell doublets excluded using FSC-A and FSC-H dot plots. CD3−CD14− cells were selected and B cells identified as CD19+CD22+ cells (top panel). Although the overall number of circulating B cells did not differ significantly between melanoma patients and healthy volunteer samples (lower panel, left for % of total PBMCs and numbers of B cell events), the IgG4+ cells were selected from the CD45+CD22+CD19+CD3−CD14− cell compartment. Representative dot plots depicting IgG4+ (CD45+CD22+CD19+CD3−CD14−) peripheral B cells from PBMCs of a healthy volunteer (middle) and of a melanoma patient (right) (lower panel). (B) Left and Middle: The number (left) and frequency (middle) of the IgG4+ peripheral B cell compartment (based on counted CD45+CD22+CD19+CD3−CD14− cells) of 24 healthy volunteer and 47 melanoma patient samples showed statistically significantly higher levels of IgG4+ B cells in the patient group (Mann-Whitney-U-test; P = 0.01; P = 0.003); Right: IgG4+ B cell frequencies differed significantly between Stages I–II (n = 24; *** P <0.001) or Stage III–IV (n = 23; * P<0.05) vs. healthy volunteers (n = 24). Statistical analysis was performed by Kruskal-Wallis one-way analysis of variance with post-hoc Dunn's test; lines represent medians and error bars indicate interquartile range. (C) Frequency of circulating IgG4+ B cells from patients with local (Stages I–II) or metastatic (Stages III–IV) melanoma and correlation with risk of disease progression. Statistical analysis was performed by Mann-Whitney-U-test; lines represent medians and error bars indicate interquartile range. Corresponding ROC analyses are depicted directly underneath each column graph. In the Stage I–II patient cohort, patients with stable disease had a significantly lower frequency of IgG4+ B cells vs. patients with progressive disease (*P = 0.014). For this cohort, a median AUC of 0.81 was calculated by ROC analysis.

