Figure 3.

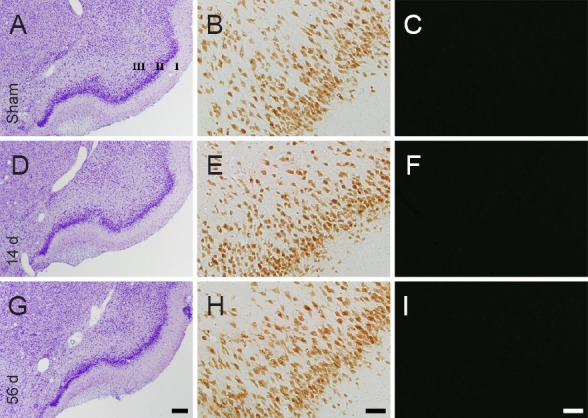
Cresyl violet (CV) staining (the left panels), NeuN immunohistochemistry (the middle panels) and Fluoro-Jade B (F-J B) histofluorescence staining (the right panels) of the piriform cortex in the sham-operated rats (sham; A–C) and myocardial infarction (MI) rats at 14 (D–F) and 56 days (G–I) after MI.
In the MI groups, patterns of CV-, NeuN- and F-J B-positive cells in the piriform cortex are similar to those in the sham group. “I–III” indicate layers of the cingulate cortex. Scale bars: 200 μm in A, D, G and 50 μm in B, C, E, F, H and I. d: Days.
