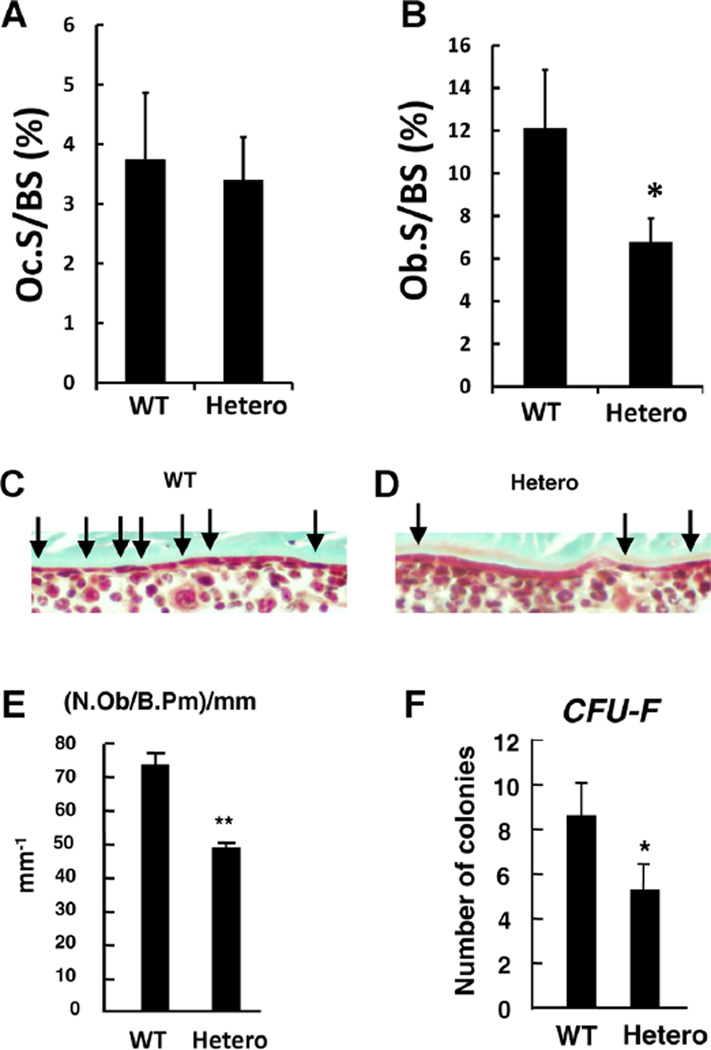
Fig. 2.
Reduction in osteoblast number, but not osteoclast number in Akap13+/− mice. (A) Femurs from WT or Akap13+/− mice at 20 weeks of age were assessed for OcS/BS% using TRAP staining. Differences were not significant (p = 0.40; n = 6/group). (B) ObS/BS% was assessed using Goldner’s trichrome staining of trabecula from femurs from 20-week-old WT or Akap13 haploinsufficient mice (Hetero). n = 6 per group; *p < 0.05. (C, D) Quantification of osteoblast number by Goldner’s trichrome (bone is green, cells are stained red) in cortical bone. Micrographs showing spatial distribution of osteoblasts (black arrows) on the endosteum of WT (C) or Akap13+/− (Hetero) mice (D) showed a reduced number of osteoblasts in the Akap13+/− mice. (E) N.Ob/Ob.Pm data expressed quantitatively for WT or Akap13+/− mice (Hetero), error bars = SE, ** p < 0.01. (F) Colony forming efficiency (the number of CFU-Fs that give rise to colonies) was analyzed in BMSCs of WT and Akap13+/− mice (Hetero). Bars represent the mean ± SE, (n = 5; *p < 0.05). OcS/BS% = osteoclast surface per bone surface; TRAP = tartrate-resistant acid phosphatase; ObS/BS% = osteoblast surface per bone surface; Hetero = Akap13 haploinsufficient mice; N.Ob = osteoblast number; Ob.Pm = osteoblast perimeter.

