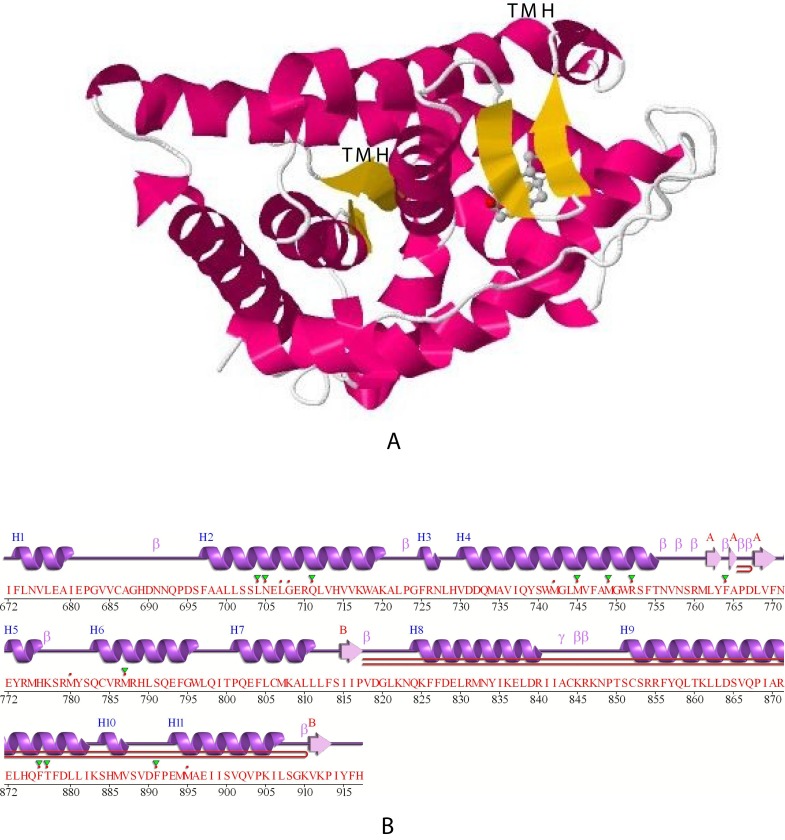
Figure 7. Jmol projection and PDB-predicted secondary structure of rat ARB. The upper image (A) illustrates a JMol projection of the crystal structure of the ligand binding domain of rat ARB (1i37, P15207).
The two transmembrane helices are identified by “TMH” in the center (dark red) and upper right (dark red) and correspond to residues 738Q – R752 and 803E – F813, respectively. The lower projection (B) indicates the α-helices and the β strand structures (indicated in yellow), as predicted by PDB. See Methods.

