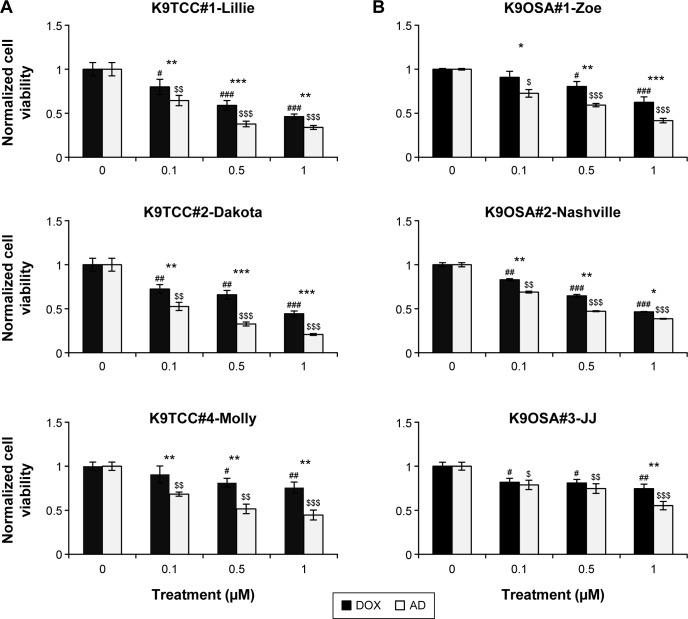
Figure 2.
DOX- and AD198 (AD)-inhibited cell viability of tested K9TCC and K9OSA cell lines.
Notes: (A) K9TCC#1-Lillie, K9TCC#2-Dakota, and K9TCC#4-Molly and (B) K9OSA#1-Zoe, K9OSA#2-Nashville, K9OSA#3-JJ cells were treated with DOX (dark bars) and AD (white bars) at 0, 0.1, 0.5, and 1 μM for 48 hours and compared to control groups. Cell proliferation was determined by MTS assay and relative cell growth rate was normalized to control groups. Values represent mean ± standard error (n=16) of four replicates from four independent experiments. Paired Student’s t-tests comparing DOX treatment to control (#P<0.05, ##P<0.01, ###P<0.001), AD treatment to control ($P<0.05, $$P<0.01, $$$P<0.001), and AD to DOX treatment groups with the same dose treatment (*P<0.05, **P<0.01, ***P<0.001) were used.
Abbreviations: AD, AD198; DOX, doxorubicin; K9OSA, canine osteosarcoma; K9TCC, canine transitional cell carcinoma; MTS, 3-(4,5-dimethyl-2-yl)-5-(3-carboxymethoxyphenyl)-2-(4-sulfophenyl)-2H-tetrazolium.

