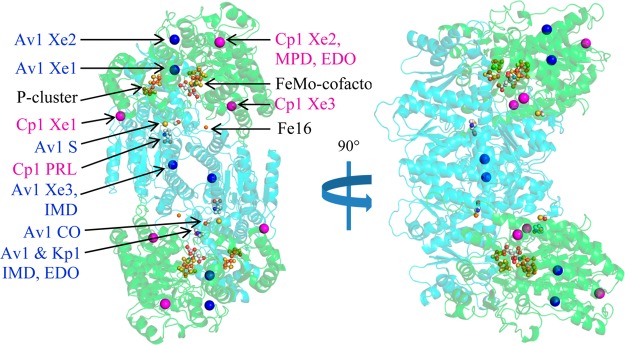
Figure 1.

Ribbon representation of Cp1 with the locations indicated for all Xe, PRL, and other small molecule binding sites. The α- and β-subunits are colored in green and cyan, respectively. The FeMo-cofactor, P-cluster, Fe16, and small molecules are displayed as small spheres colored by element. Av1 and Cp1 Xe sites are shown in large blue and magenta spheres, respectively. Binding sites observed in Av1 and Kp1 structures are superposed onto the Cp1 structure. (Cp1-Xe PDB ID: 4WN9; Av1-Xe PDB ID: 4WNA).
