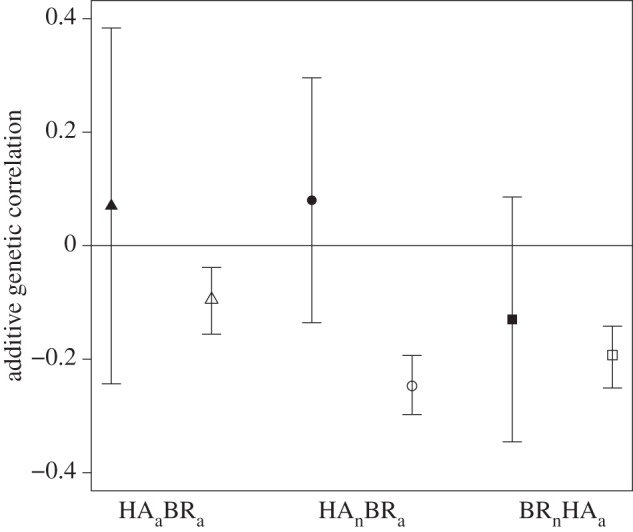
Figure 2.

Correlation between HA and BR in adults (rA(HAa,BRa)) and the cross-trait-cross-ontogeny correlations (rA(BRn,HAa) and rA(HAn,BRa)), estimated by the animal model (filled symbols) and derived from the simulation (open symbols). For the simulation, the 95% credible interval were estimated using the highest posterior density distribution of the correlations, and for the estimates derived from the animal model, approximate confidence intervals were obtained by multiplying their s.e. by 1.96.
