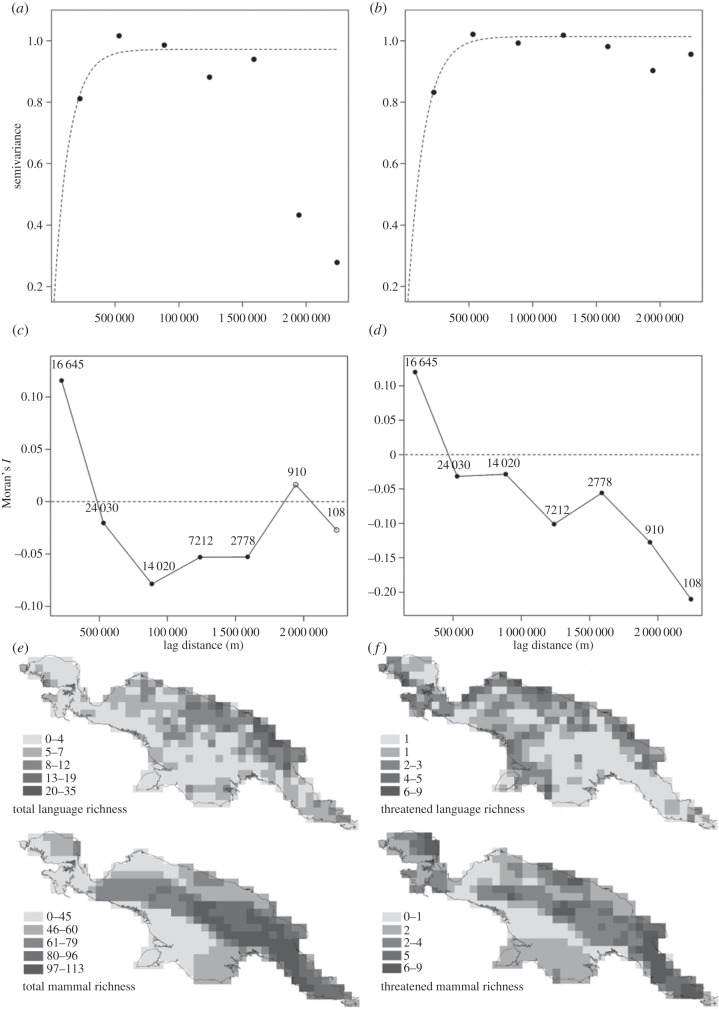
Figure 1.
Semivariograms and correlograms of spatial dependence in the residuals of general linear models (GLMs) between total language and mammal species richness (a,c,e) and threatened language and threatened mammal species richness (b,d,f) across New Guinea within seven equally spaced distance classes (the minimum number at which all classes contained more than 100 observations between pairs of residuals). Maps of total language and mammal species richness (e) and threatened language and mammal species richness (f) across New Guinea at the 50 km2 grid considered in our analyses are also provided (increasing richness from paler to darker squares in richness bins selected according to natural breaks in the distribution of respective richness indices; see legends in (e) and (f)). The semivariograms (a) and (b) describe the similarity between pairs of model residuals according to Euclidean distance between them in space within the seven distance classes. Exponential variogram models (dashed line) have been approximated to model the spatial dependence of GLM model residuals for both relationships; the point of asymptote (or sill) depicts the distance at which spatial autocorrelation no longer exists in these residuals. The correlograms (c) and (d) describe the level and direction of spatial autocorrelation present in the GLM model residuals at each distance class (numbers of observations within each distance class is provided in the figure). Positive values of Moran's I denote positive spatial autocorrelation between model residuals, while negative values denote negative spatial autocorrelation. Filled circles indicate significant levels of spatial autocorrelation for given distance classes (Moran's I; R = 1000 permutation tests), while empty circles indicate non-significant levels of spatial autocorrelation.

