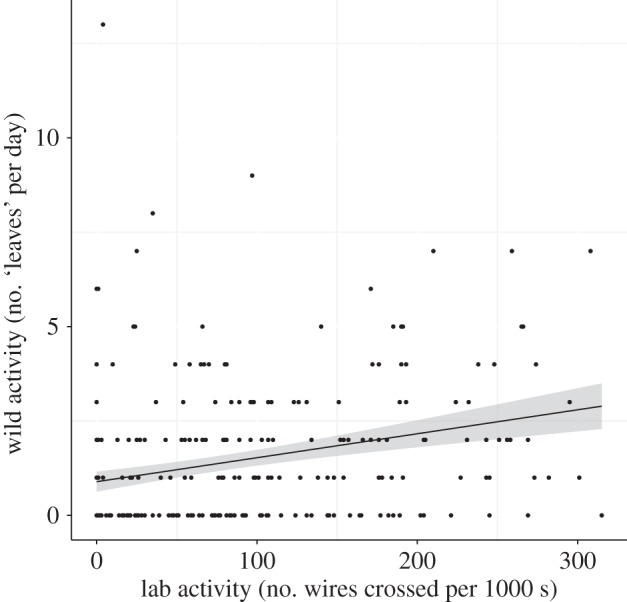
Figure 2.

Laboratory activity and wild activity. The line is from a simple linear model of wild activity and laboratory activity, the grey area indicates the standard errors around the estimate. There was a significant, positive relationship between activity in the laboratory and activity in the wild (PDM ± 95% CRIs = 5.98 ± 3.99−8.89).
