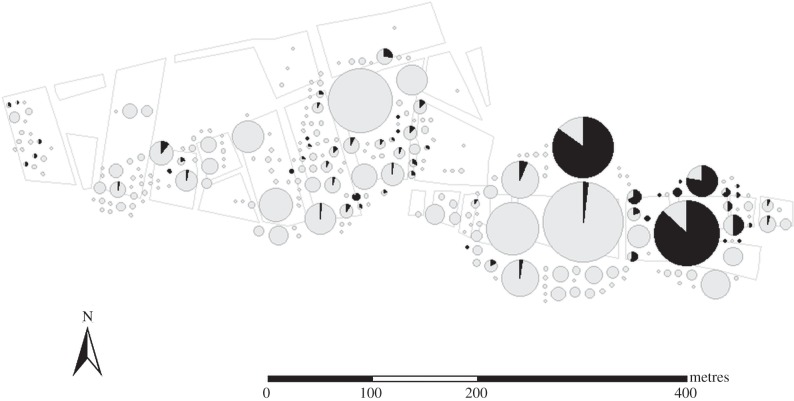
Figure 1.
Spatial distribution of T. cruzi infection status of T. infestans colonies collected from the community of Villa La Joya, Arequipa, Peru, between Aug and Nov of 2008. Vector colonies are represented by pie charts scaled by the number of vectors (ranging from 1 to 1414) collected at each site. The proportion of T. cruzi-infected triatomines in each colony is shown in black.

